What Is Technical Analysis in Crypto Trading?
Technical analysis in crypto trading refers to the examination of price charts, chart patterns, and trading activity using historical price data, with the aim of predicting possible future price movements.
This article discusses the key concepts of technical analysis, including the use of charts, candlestick patterns, and different types of indicators to determine possible price movements. This trading approach is suitable for both beginners and experts, and it can help them identify market trends and make strategic decisions in the crypto market.

CoinHint’s Overview of Technical Analysis in Crypto
A Definition of Technical Analysis
Technical analysis is a widespread trading method involving the examination of historical trends to predict price movements in crypto markets. This approach relies on the belief that previous market patterns can determine future price movements. It involves analyzing charts together with other trading indicators to recognize price patterns based on existing market trends. Technical analysis aims to help traders discern bullish and bearish price movements, empowering them with informed decision-making abilities.
The Role of Historical Price Data
Technical price analysis rests on the belief that historical price patterns tend to repeat. In technical analysis, traders believe past price movements and chart patterns can provide accurate future price movements. At the core of this trading approach lies the assumption that all known information about a particular crypto asset is reflected in its price, suggesting that the price is a fair representation of its value. That is why analysts use historical price data to identify patterns that may signal the direction of a price movement in the market.
Basics of Technical Analysis
The basics of technical analysis include:
- Chart analysis: This involves the use of various types of charts including candlestick charts, point-and-figure charts, bar charts, and line charts.
- Pattern recognition: Market participants look for repeating chart formations in the market data that can hint at future price movements. Some common patterns include cup-and-handle (C&H) chart patterns, double tops and bottoms, support and resistance, trendlines, bullish and bearish flags, and triangles and pennants.
- Technical indicators and their usage: Technical indicators are mathematical patterns derived from historical data and they are used by traders and investors to predict an asset’s price movements.
- Trend identification: Through technical analysis, traders can determine whether a trend is likely to continue or reverse. Traders often use candlestick patterns to identify potential trend changes or market reversals
- Support and resistance levels: These are zones in the price chart where the price reverses, resulting in a trend change. A support level forms when the ask is higher than the bid, while a resistance level forms when the bid is higher than the ask.
Importance of Technical Analysis (TA) in Crypto Trading
Understanding technical analysis is vital when trading cryptocurrencies as the market is highly volatile and operates 24/7 round the clock.
However, TA (technical analysis) helps traders to:
- Determine the entering and closing positions in the market
- Determine potential trend reversals
- Make decisive choices
- Manage risks
- Understand the underlying market sentiment
Key Tools Used in Crypto Technical Analysis Explained
Moving Averages
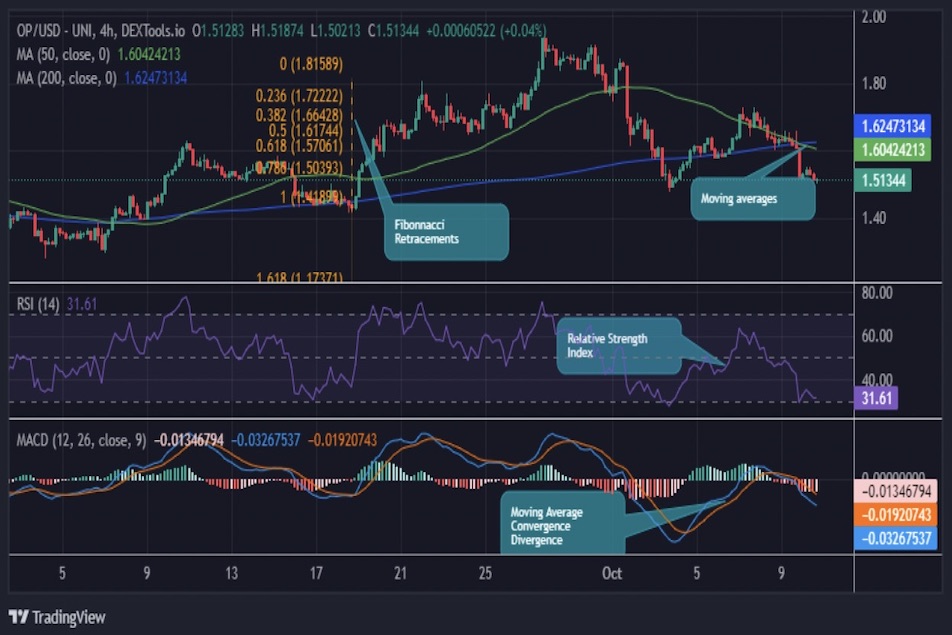
Using moving averages clears price data and forms one seamless line, which is useful in helping the trader establish trends. They are divided into two major categories: the simple moving averages (SMAs) and the exponential moving averages (EMAs).
Relative Strength Index (RSI)
The Relative Strength Index is a trend-following momentum-based index that determines the velocity of change in prices. This ranges freely from zero to one hundred, with direct figures above seventy considered overbought (which means the asset is overvalued) and figures below thirty deemed oversold (which means the asset is undervalued)).
The Moving Average Convergence Divergence (MACD) Indicator
The MACD is another trend-following momentum indicator that displays the trend of a particular crypto by comparing two moving averages of its price. If the MACD line flips above the signal line, traders are inclined to buy, and vice versa.
Fibonacci Retracement
Fibonacci retracement is grounded on the hypothesis that the market will return a fairly certain portion of a move, and then proceed with the move in the original direction.
How To Read Crypto Charts
Candlestick Charts
Candlestick charts are the most common chart type used in the trading of cryptocurrencies. They offer a lot of information you can get at first sight, which can help a trader, analyst or learner depict the price action.
Components of a Candlestick
- Body
- Wicks
- Green and Red Candlestick
- Size and shape of the candlestick
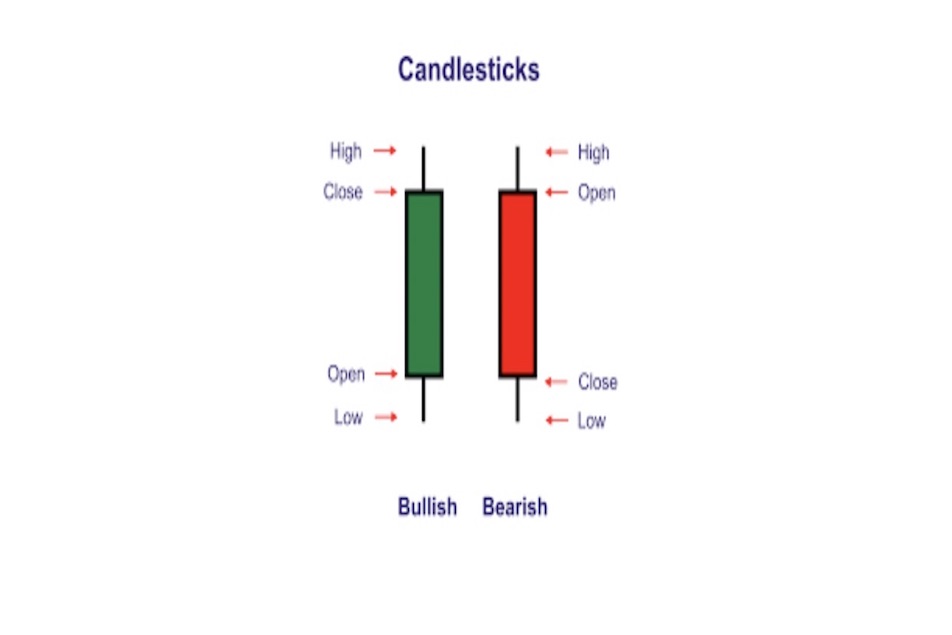
Therefore, a candlestick chart enables one to understand the following:
- That the body represents the difference in the price between its opening and closing.
- The wicks demonstrate the upper and lower limits of cryptocurrency’s price for the period. Moreover, the wicks can be long or short, depending on the price action. Note that the size of the wick can also provide insights into the market sentiment.
- The green or white candlesticks mark a bullish wave.
- The bearish movement is marked by black or red candlesticks.
Support and Resistance Levels
Support and resistance levels are price points that the token has difficulty surpassing unless the market dynamics shift or external events occur.
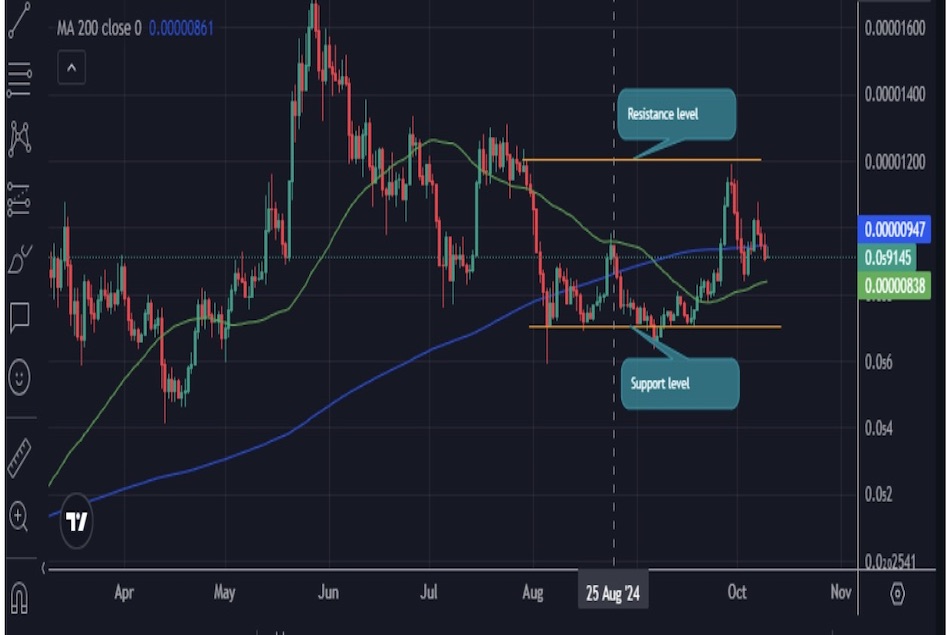
Support levels are where the crypto prices stop falling further, while the resistance levels are price points where they tend to stop rallying or rising. However, these levels can sometimes switch roles depending on the market sentiment.
It is worth noting that:
- Support levels are where the bulls gain stamina to defend against further losses. In other words, this is where the buying pressure prevents further price drops.
- The resistance zones are where the bulls exhaust the uptrend, giving the bears way in the market. In a layperson’s language, these are the price points where the selling pressure acclimatizes, preventing a further uptrend.
- When the support level is broken, it can become an immediate resistance zone and vice versa.
- Lastly, when a resistance or support level is tested multiple times without breaking, it becomes stronger. This means that a very strong market activity, such as the most recent (Israel-Iran war), could trigger a price break in either direction, dismantling the levels.
Trendlines and Chart Patterns
Trendlines enable traders to identify the overall direction of the market, while chart patterns signal the movement of an asset’s price. This can signal a bullish, bearish, reversal, or trend continuation.
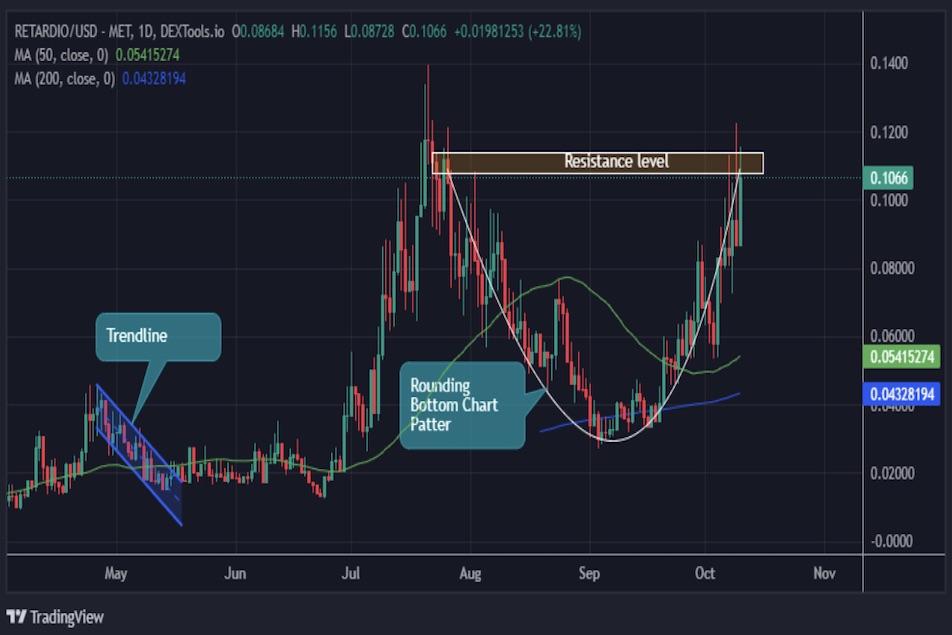
There are various trendlines, including uptrend and downtrend lines. The uptrend lines consist of higher highs, indicating a bull market sentiment. On the other hand, the downtrend lines comprise lower highs and lower lows (e.g., the one drawn on the diagram above), suggesting a bearish market sentiment. Moreover, chart patterns in technical analysis can help determine whether the market is bullish or bearish. Some of the patterns include:
Bullish Chart Patterns
- Ascending triangle
- Rounded Bottom
- Falling wedges
- Cup and handle
- Inverted head and shoulder
- Double bottom
- Ascending parallel channel
Bearish Chart Patterns
- Rising wedges
- Descending Triangle
- Head and shoulder
- Double top
- Descending parallel channel
Volume Indicators
Volume indicators refer to the number of assets transacted within a period and normally determine the trend of price direction.
Increasing volume in crypto movements often suggests intense market activity among traders and investors. In other words, the market is highly bullish, with traders adding to their positions.
Conversely, a decrease in volume indicates a fall in market activity. In other words, it may signal potential price reversal or weakness, tilting the odds in favor of the bears.
Noteworthy, volume is crucial in conjunction with crypto prices for a more complete analysis or decision on the market.
Advanced Technical Analysis Tools
Advanced technical tools involve specialized tools and techniques, such as Ichimoku Clouds, Bollinger Bands, and Pivotal Points.
- Ichimoku Clouds – These are a collection of technical indicators that provide more plotted data points, including support and resistance levels, momentum, and trend direction.
- Pivotal Points – These pivot points are used to identify the general market trend and support and resistance levels across various time zones.
- Bollinger Bands – It is a technical indicator used to measure the market’s volatility and identify overbought or oversold conditions.
Common Mistakes to Avoid In Crypto Technical Analysis
- Over-reliance on a single indicator: Always make use of more than one indicator where confirmations are required.
- Ignoring timeframes: Remember to make your analysis relative to the time frame you are trading the market.
- Neglecting fundamental analysis: Use technical data together with basic assessment for the best future price results.
- Emotional trading: Stay loyal to your plan and do not deviate from the set system at any particular time.
- Confirmation bias: Approach facts in focus as objectively as possible.
- Overtrading: As for the second piece of advice, it will be much wiser for beginners to select really good averages and wait for high-probability setups.
- Neglecting risk management: Risk management should always be done thoroughly and properly.
Conclusion
Technical analysis is helpful in trading, particularly in the cryptocurrency market. The information helps traders predict the next move in prices. Charts, indicators, and other possibilities make a difference through the information they provide, enabling traders to make better decisions in the market. However, our CoinHint analysts caution that as with any analysis method, there are no perfect indications or predictions, as crypto markets are unpredictable and highly volatile. Overall though, technical analysis is advantageous when implemented in conjunction with fundamental research and risk management. This will always result in stronger trading activity in this ever-changing crypto market.
FAQ
-
Do I only need to conduct a technical analysis to trade crypto?
No. Technical analysis works well when used in conjunction with fundamental analysis and an understanding of market sentiment.
-
Is technical analysis accurate on crypto?
Technical analysis is often accurate; however, the accuracy sometimes varies. This is because the cryptocurrency market is highly volatile, and external events can influence price movements. For example, the Israel-Iran missile war is an external event that caused the crypto market to move downward, causing crypto prices to decline.
-
Is technical analysis 100% accurate?
No. Technical analysis offers outcomes in terms of probabilities and probable schemes; it is not precise. Making decisions with it is only an aid, not an assurance that they will come out the way those using the tool want them to.
-
How can I best learn technical analysis?
Learning technical analysis in this era is easy, so long as one has a smartphone, a laptop, internet access, and the appetite to learn. Here are some simple techniques to imply:
- Start with studying the basics in books and on websites containing technical analysis information.
- Practice with a paper trading account or a demo account what you have learned through books and websites.
- To hone your skills, you can also join online trading discussions and forums for new ideas.
- Try using indicators while analyzing historical data.
- Use simple technical indicators, then progress to others with time.


