- What is a Trend Line?
- Types of Trend Lines
- How to Read Crypto Charts
- What Do Trend Lines Demonstrate?
- Why Is Reading Cryptocurrency Charts Essential for Crypto Traders?
- How to Use Trend Lines
- How to Draw Trend Lines on Crypto Charts
- Drawing Valid Trend Lines
- Special Tips for Using Trendlines
- Conclusion
- FAQ
Trend Lines Indicator for Crypto Trading
The trend line is a popular technical analysis tool that crypto traders use to determine the direction of a trend. They are drawn along a trend’s extreme data points, allowing traders to determine all important support and resistance levels.
This article will discuss the basics of trend lines in crypto and how you can use them to make better trading decisions. If you find technical analysis intimidating, understanding how to identify trend lines is a fantastic way to start, so keep reading.
- What is a Trend Line?
- Types of Trend Lines
- How to Read Crypto Charts
- What Do Trend Lines Demonstrate?
- Why Is Reading Cryptocurrency Charts Essential for Crypto Traders?
- How to Use Trend Lines
- How to Draw Trend Lines on Crypto Charts
- Drawing Valid Trend Lines
- Special Tips for Using Trendlines
- Conclusion
- FAQ
What is a Trend Line?
Trend lines are diagonal lines drawn on price charts to connect data points, allowing cryptocurrency traders to visualize price movements properly and identify possible market trends.
They work as support and resistance levels and are made of diagonal lines (instead of the usual horizontal lines). As such, trend lines can have a positive or negative slope, with steeper slopes in either direction signifying stronger trends.
When prices are consistently trending upwards, for instance, then the trend line will slant upward. During a downtrend, however, the trend line will slope downward.
Types of Trend Lines
Trend lines can be divided into two basic categories:
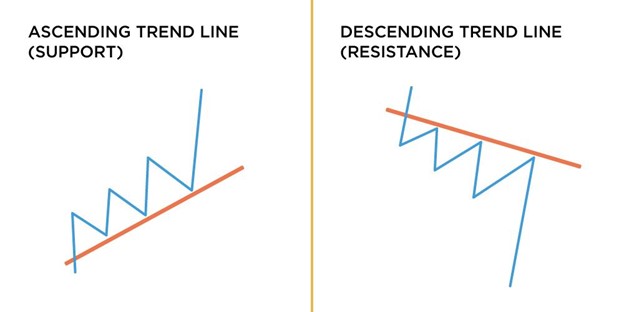
- Ascending (Uptrend): An uptrend or ascending line is drawn from a lower chart position to a higher one. It connects two or more low points trending up, as shown in the image above.
- Descending (Downtrend): In contrast, a downtrend or descending line is drawn from a higher chart position to a lower one. Such a line connects two or more high points trending down.
How to Read Crypto Charts
A rudimentary understanding of crypto charts can often be quite helpful – even without more sophisticated technical indicators. Crypto trend lines are momentum indicators, meaning they measure the rate or velocity at which an asset’s price is increasing over time.
Reading a crypto chart accurately usually involves some basic principles that can help the beginner trader make better trading decisions:
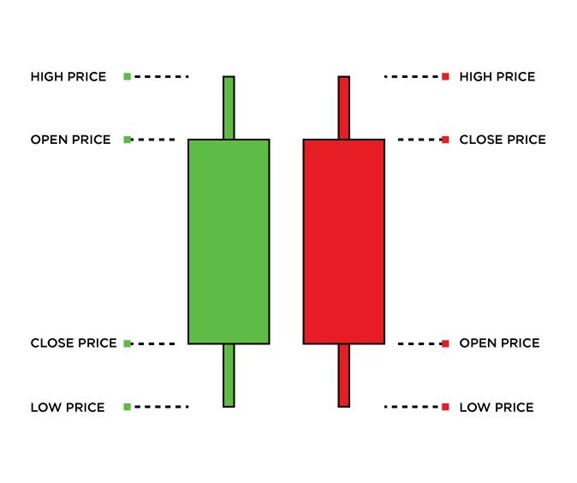
- Candles: In a typical chart, you’ll see candlesticks in green and red, which indicate an overall decrease or increase in price within a given time frame. Candlesticks represent an asset’s price open, high, low, and close, as depicted in the image below.
- Traded volume:Usually, at the bottom of a chart are dates and volume bars representing an asset’s total traded volume. When there are more sellers than buyers, volume bars and candlesticks are red; Conversely, when there are more buyers than sellers, candlesticks are green.
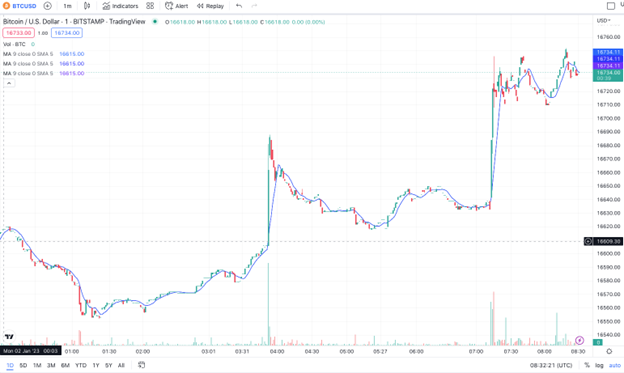
- Asset price: The right-hand side of the chart shows the instrument’s price. In the example above, the price of Bitcoin is shown in USD.
- Time intervals: Cryptocurrency price charts can be viewed in intervals such as 1, 5, 15, or 30 minutes or 1, 2, 4, 6, 8, 12, and 24 hours.
What Do Trend Lines Demonstrate?
Trend lines depict the strength of buyers versus sellers in a market and can be used to measure the supply and demand for a particular asset. In addition, it can be used to identify areas of support and resistance.
Support refers to the point where sellers stop selling and buyers start buying. On the other hand, resistance refers to the ceiling that holds prices down in a chart. When buyers see that prices are skyrocketing, they may stop buying, prompting sellers to emerge again once an asset’s price is no longer rising.
Uptrends (Ascending)
An uptrend indicates a higher demand than the current supply, meaning that prices are likely to continue rising. Technical traders often use trend lines to pinpoint uptrends and spot potential reversals. Because trend lines are drawn along rising swing lows, they often help show where future swing lows may form.
Downtrends (Descending)
Downtrends indicate an excess supply of a given asset. This means the current market has a higher appetite for selling than buying the said asset. Typically, traders should avoid holding long/buy positions when a trend line slopes down, as gains are less likely when long-term trends are headed down.
Why Is Reading Cryptocurrency Charts Essential for Crypto Traders?
Cryptocurrency charts provide traders with critical insights into the market, allowing technical analysis to uncover valuable trends and forecast future prices of an asset. By reading these charts carefully, crypto traders can locate optimal opportunities to maximize their investment returns.
Crypto charts also allow traders to gain useful insights into when bullish and bearish trends will end. A bullish movement is an optimistic sign of increasing prices due to the bulls, or buyers, driving up demand. On the other hand, a bearish movement may convey pessimism since it suggests that more sellers active in the market are pushing down the price.
How to Use Trend Lines
There are several ways for traders to trade a trend line:
Trend Following
This is a trading approach that takes advantage of market price swings, buying in an uptrend and selling short in a downtrend. Trend lines can be used to establish if there is indeed an increase or decrease in prices within a certain timeframe, allowing traders to make decisions based on this data.
Countertrend Trading
Countertrend trading capitalizes on the ebbs and flows of the market by selling when an instrument’s price is climbing and going long when the price declines. This is an example of the well-known investment strategy of being market ‘contrarian’ going against the prevailing momentum.
How to Draw Trend Lines on Crypto Charts
Unlike other indicators, trend lines often cannot be turned ‘on or off’ with software. Although the option is available to draw trend lines from a dataset automatically, it’s far more accurate when done by hand. By using the “draw line” function in charting tools, analysts can quickly and accurately create meaningful trend lines that provide instant insights into data sets.
Uptrends (Ascending)
First, locate two or three common low points to create a pattern of increasingly higher lows. Once you’ve identified the lowest points on a trend line, you can activate the charting software’s line-drawing tool.
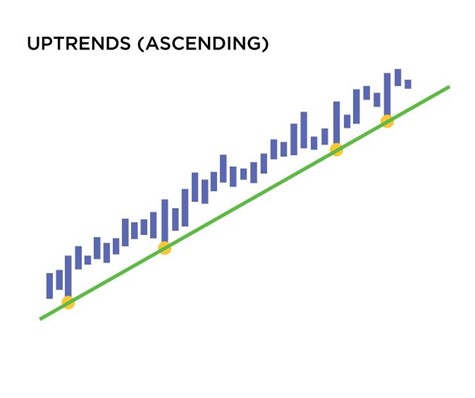
Click the lowest point on the trend, then click at another common low point toward the right. When drawing an ascending trend line, ensure that it traverses the lower, outer edges of the candle wicks, not through their bodies (see the image above for an example).
Downtrends (Descending)
Drawing a descending trend line is the same as drawing an ascending one, except it is in the opposite direction. Descending trend lines are often found in down-trending markets, so look for a crypto market going through consolidation, with prices consistently correcting lower within various time frames. Then, look for two or more common high points within this correction. They should reflect a series of lower highs – see the below image for an example.
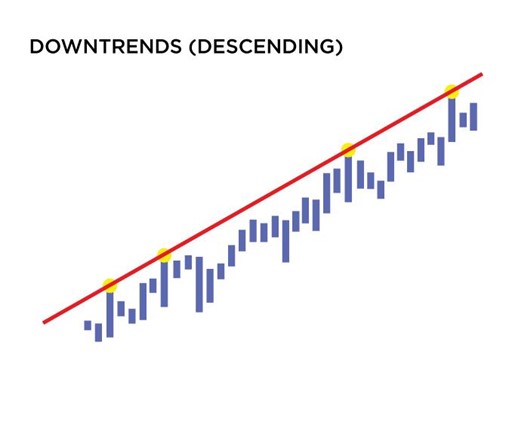
Activate the line drawing tool, then click on the leftmost high point, followed by clicking toward the right to finish your trend line. Check that the line covers the higher parts of the candle wicks, not their bodies.
Drawing Valid Trend Lines
When drawing trend lines, it is best to only pick the most obvious ones. If something doesn’t pop out immediately, don’t force it, it may not be valid — zoom out on the chart or switch to a higher time frame, such as daily charts, for better accuracy. That way you can draw trends from longer timeframes on the chart, so your pattern remains valid.
Drawing a trend line between two points on a chart is technically possible, but three or more points are necessary to make it truly valid. In certain situations, the first two points can be utilized to define what could become an upcoming trend, and the third point provides proof of its validity as a trend.
Special Tips for Using Trendlines
Here are a few tips and tricks to help you better understand trend lines:
- Trend Line Angles: The best trend line indicator is about 45 degrees. Anything steeper means that prices are rising too quickly, and anything shallower signifies a weaker trend
- Number of Touches: The more spread out the touches, the more reliable the line is. However, after five touches, the chance of it “breaking” is significantly higher
- Trendline Zones: Trend lines can be thought of as more of a general “zone” and not an exact point. Understanding this will help you identify your entry price and stop loss better
Conclusion
Using trend lines can give traders a good grasp of the current market direction and can help flag up potential points to enter or exit trades. By understanding how to draw trend lines on crypto charts, you can make better-informed decisions about when to buy and sell cryptocurrencies and what to expect concerning your holdings.
Overall, they are a simple but very helpful technical tool that even beginner traders can utilize. At the same time, Coin Hint experts add that it’s important to remember that trend lines are nothing more than a visual representation of the data set, so always use other indicators to corroborate their accuracy when making trading decisions.
FAQ
-
Do trend lines work in crypto?
Yes, trend lines can be used in crypto to identify trends which are likely to persist, and to identify optimal trade entry and exit points within them.
-
How do you use trend lines in crypto?
Trend lines can be used in crypto to identify trend direction and likely support and resistance areas.
-
What do trend lines tell you?
Trend lines can indicate whether an asset’s price is trending up or down to help you strategize better.
-
How to identify trend lines?
The best trend lines jump out at you when you glance at a price chart. Don’t try too hard to find them, let them find you.
-
Which indicators are best for trend trading?
The best indicators for trend trading are:
- Bollinger Bands
- Relative Strength Index Indicator
- Moving Average Convergence Divergence
-
Is trend line trading accurate?
When drawn correctly, trend lines can be a reliable indicator used in conjunction with other metrics.
-
What is the most accurate trend line?
The most obvious, long-term trend lines with at least three widely spaced touches tend to be the most accurate trend lines.
-
What are the three types of trends?
The three types of trends are:
- Uptrend
- Downtrend
- Sideways Trend
-
How do you master a trend line?
Master a trend line by focusing only on the major points and only draw lines on the most obvious ones.
-
What happens when a trend line breaks?
When a trend line breaks, it may indicate a change in the trend.


