Top 10 Indicators for Cryptocurrency Trading
Updated on Sep 18, 2024
Trading indicators analyze price movements and predict future price changes for speculative assets such as cryptocurrencies. In the context of cryptocurrency, most of these indicators are technical analysis (TA) indicators.
Technical analysis in crypto combines statistics with identifiable patterns that, to the trained eye, can signal likely future price movements. In addition, TA can also help traders do the following:
- Gain a better understanding of trend direction
- Identify possible points of trend reversals
- Outline support and resistance levels
- Formulate and implement strategies to protect capital
- Gauge overall market sentiment
Read on to understand which are the best indicators you can use to become a more profitable cryptocurrency trader.
What is a Trading Indicator?
Trading indicators are technical tools using graphs and mathematical formulae calculated from prices to show whether the market is moving up, down, or sideways, and from there what its next price movement is most likely to be. By studying past market movements, traders can get an idea of where the prices will likely go in the future.
It’s important to note, however, that as helpful as indicators can be in predicting which way the market is moving, they cannot give you definitive answers about where prices will end up. Generally, their main use is to help traders find good trading opportunities that maximize profit and keep losses at a minimum.
In a nutshell, trading indicators are mathematical computations that traders use to identify specific trends and signs in the market. These computations are plotted as lines on a price chart, allowing patterns to help traders predict how prices might move.
Types of Indicators for Cryptocurrency Trading
So, what is the best indicator for cryptocurrency? While no single indicator is universally regarded as the best indicator for cryptocurrency trading, certain indicators are commonly recommended more by traders and investment experts.
Crypto Technical Analysis Indicators
Crypto technical analysis indicators are based entirely on past prices and allow traders to analyze past price movements, volume and trading activity, and other factors that may help them determine likely future price changes. Cryptocurrencies tend to fluctuate more than traditional mainstream assets, so traders need to pay close attention to volatility when conducting technical analysis.
Some indicators, such as the On Balance Volume (OBV) indicator, are better equipped to do this than others. The OBV indexes the inflow of money from institutional investors by analyzing past trading volume over days, weeks, and months. If it rises, it’s usually a sign that price momentum is also increasing.
Technical indicators are divided into four further subtypes:
1. Trend Indicators
A crypto trend indicator helps traders objectively measure an asset’s price direction to understand a trend’s strength better. Price data is much simpler to analyze when it’s smoothed out and represented by a single line, making it easier for traders to find the best times to enter and exit trades.
Some of the best indicators for crypto day trading when looking at price trends are the Bollinger Band, Moving Average Convergence Divergence (MACD), Relative Strength Index (RSI), and On Balance Volume (OBV) indicators.
2. Volatility Indicators
The cryptocurrency market is notoriously unstable, making volatility indicators some of the top indicators for crypto trading. A volatility indicator in crypto measures the speed of price movement, regardless of direction.
When markets experience high volatility – characterized by sharp up-and-down swings in price – traders can use these indicators to time their trades correctly, despite rocky conditions. Bollinger Bands, Standard Deviation, and Average True Range (ATR) are some of the best volatility indicators.
3. Momentum Indicators
Also called oscillator indicators, momentum indicators seek to identify possible trends based on the speed of price movements that have not started yet. By comparing prices over a period, momentum indicators oscillate between two limits to measure a trend’s momentum and strength.
Typically, oscillators in crypto allow traders to determine whether market conditions are overbought or oversold. MACD, RSI, and Average Directional Index (ADX) are among the top momentum indicators.
4. Volume Indicators
A crypto volume indicator determines either the strength or direction of a trend depending on the movement in volume. Typically, volume indicators in crypto signal price trends that are positively correlated with volume.
As such, high volume on a rising price means that price will likely continue to rise, while low volume on a rising price indicates that the market may be losing momentum. Some of the best volume indicators for crypto are OBV, Money Flow Index (MFI), and Chaikin Money Flow (CMF).
Best Indicators for Crypto Trading and Day Trading
- Moving Average Convergence/Divergence (MACD)
- MYC Trading Indicator
- Relative Strength Index (RSI)
- Bollinger Bands
- Moving Averages (MAs)
- On-balance Volume (OBV)
- Accumulation/Distribution Line
- Average Directional Index (ADX)
- Aroon Oscillator
- Stochastic Oscillator
1. Moving Average Convergence/Divergence (MACD)
The MACD indicator is a straightforward tool that can give traders an indication to buy or sell. Convergence happens when the two sliding moving averages come closer together, while divergence occurs when they start to move further apart from each other.
The MACD provides context for both the trend and momentum of prices. Trend and momentum refer to a growing asset continuing to rise (bullish) or a falling asset continuing to go lower (bearish).
The MACD line indicates the general direction of the market. A positive trend (bullish) is indicated when it moves above zero, meaning it is a good time to enter the market. However, if the line goes below zero, the general direction is downward (bearish), meaning it is a good time to exit the market.
2. MYC Trading Indicator
The MYC indicator is a powerful tool that can help traders predict when a cryptocurrency will enter a bearish or bullish trend.
By combining trend analysis with momentum oscillators, the MYC indicator offers insights that can help traders make better decisions about their investment strategies.
It allows traders to identify whether the price rise will produce a long signal, or if the price falling will create a short signal.
3. Relative Strength Index (RSI)
The RSI is a momentum indicator that provides a quantification of recent price changes and their magnitude and speed. The RSI evaluates “oversold” and “overbought” conditions, which are given a value ranging from 0 (most oversold) to 100 (most overbought).
An oversold asset moves below the 30-range area, whereas an overbought asset moves above 70. The indicator can be identified on the chart as a single line that moves sideways between two lines.
4. Bollinger Bands
The Bollinger Bands indicator is used to observe whether the market is trading under typical or unusual conditions, both regarding trend and volatility. The indicator’s lower and upper bands move according to directional trend and price volatility.
If a price moves beyond the upper or lower band, a price reversal might be imminent. This indicator can prove to be a valuable tool for determining entry and exit points and short-term trading profits.
5. Moving Averages (MAs)
The MA is a well-known tool commonly used in the crypto market, especially for Bitcoin. In simple terms, it demonstrates the average price of a certain number of recent candles, thereby measuring price volatility over a specific duration.
As such, a trader can modify the number of periods they want to consider when setting up an MA indicator. This usually depends on their trading style, but the most often used ones are the 20, 50, and 200-period timeframes. In general, day traders tend to prefer the 20-day MA, while long-term traders typically use the 200-day MA to monitor trends better.
6. On-Balance Volume (OBV)
OBV can be an excellent tool for not only predicting future price changes in assets but also determining the strength of a signal to buy or sell those assets. This volume-weighted indicator measures the cumulative total of volume traded.
This indicator works as follows: if the price closes higher for a candlestick, then the day’s volume is added to the total reading. However, if the asset’s price closed lower for the day instead, then the volume is subtracted from the total. If there was no change in price throughout the day, then no calculations would take place. The OBV readings have worked quite well applied specifically to Bitcoin prices.
7. Accumulation/Distribution Line
The accumulation/distribution (A/D) indicator is a cumulation of volume and price that assesses whether an asset is being accumulated or distributed. The A/D looks for differences between the price and the volume flow to understand how strong a trend is likely to be.
A potential price decline could be on the horizon if the indicator is falling, but the price is rising. This suggests that buying or accumulation volume isn’t sufficient to support the current level of pricing.
8. Average Directional Index (ADX)
The ADX attempts to assess how powerful a trend might be by measuring the average of the expanding range of price values.
Taking the mean of values over a certain timeframe, the ADX can indicate the strength of a trend. If the value is above 25, it means that the trend is strong. Conversely, values below 20 are taken to indicate no trend or a weak trend.
9. Aroon Oscillator
The Aroon indicator can help traders measure the strength of a trend, as well as evaluate changes in an asset’s price. Additionally, it can be used to measure the time between highs and lows over a certain period, from which a price forecast can be drawn.
The Aroon has two lines, the Aroon Up and Aroon Down lines. When the Aroon Up line is above the Aroon Down line, it shows that prices are going up. When the Aroon Down line is above the Aroon Up line, it means prices are going down.
10. Stochastic Oscillator
The Stochastic Oscillator is a momentum indicator that compares an asset’s current closing price to its recent trading range. Generating overbought and oversold signals, this tool can be used to measure market conditions and make better trades.
Overbought signals appear when the Stochastic Oscillator is above 80, while an oversold signal appears when it falls below 20.
Do Technical Indicators Work in Crypto Trading?
Yes – as there is so much purely speculative interest in cryptocurrencies, especially the major cryptocurrencies, many technical traders report that technical indicators work very well when applied to price charts of major cryptos.
Many different factors can influence the success of using technical indicators in crypto trading. Some traders may find that certain indicators work better than others, while others may benefit from combining multiple indicators together to improve their accuracy when making trading decisions.
Ultimately, technical analysis seeks to leverage the predictability of human behavior and represent them on a price chart to help traders identify significant patterns better. The practice of TA stems from the fundamental knowledge that humans tend to be emotional — especially concerning fear and greed. TA understands that these emotions affect price action in markets like crypto (and even outside it) and thus, also affect supply and demand.
Overall, having a solid understanding of how these tools work and what to look for when using them can help traders make better decisions and increase their chances of success in crypto trading.
Conclusion
Overall, there are a variety of different technical indicators that can be used in crypto trading to help traders make more informed decisions and potentially improve their success. Coin Hint details about them all.
Factors such as choosing the right indicators for your specific crypto trading strategy, having a good grasp of what each indicator is trying to measure, and using multiple indicators can all help improve the effectiveness of using technical indicators in crypto trading.
Some traders also find it helpful to combine technical analysis with fundamental analysis, which essentially looks at an asset’s intrinsic value. By doing so, they get a clearer picture of what the asset is worth, in addition to the data that TA provides.
As with any type of trading, there is no guaranteed way to be successful, but by carefully weighing the risks and benefits of each indicator, traders can improve their chances of achieving success in this exciting and dynamic market.
FAQ
-
Are crypto indicators worth it?
Crypto indicators provide a good way for traders to assess market conditions and make more informed trading decisions.
-
Which trading indicator is most accurate in crypto trading?
No indicator is 100% accurate, but the RSI is particularly robust and often used by traders to measure momentum and potential changes in market trends.
-
What is the best indicator for crypto?
Aside from RSI, MAs are also commonly used by traders to measure market trends and fluctuations in pricing.
-
What is the fastest leading indicator?
Most analysts agree that the Schaff Trend (STC) Indicator is akin to a better version of the MACD because it considers both MAs and time cycles.
-
What indicators are best to use for crypto day trading?
If you’re into day trading, the indicators discussed above, such as the RSI, MAs, Stochastic Oscillator, and Aroon Oscillator, are all commonly used by traders and could serve you well.
-
What is the best trading strategy for crypto?
Trend following strategies have worked very well with major cryptocurrencies over recent years.
-
Is RSI a good indicator for crypto?
Yes, RSI is one of the most popular indicators and is trusted by many traders because of its reliability, especially on higher time frames.
-
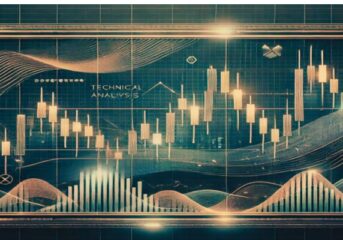 What Is Technical Analysis in Crypto Trading?Technical analysis in crypto trading refers to the examination of price charts, chart patterns, and trading activity using historical price data, with the aim of predicting possible future price movements. This article discusses the key concepts of technical analysis, including the use of charts, candlestick patterns, and different types of indicators to determine possible price movements. This trading approach is suitable for both beginners and experts, and it can help them identify market trends and make strategic decisions in the crypto market.
 -
 Exponential Moving Average (EMA) Explained for Crypto InvestorsOne of the keys to mastering cryptocurrency investing and trading is getting to grips with technical analysis and using technical indicators. The exponential moving average (EMA) is a technical indicator used by crypto investors to navigate the intense volatility of cryptocurrency prices.
 -
 What is Moving Average Convergence Divergence (MACD) Indicator?Moving Averages Convergence Divergence (MACD) is an extremely popular indicator used by traders across a wide range of financial instruments. It has gained the attention of crypto traders over the past few years.
 -
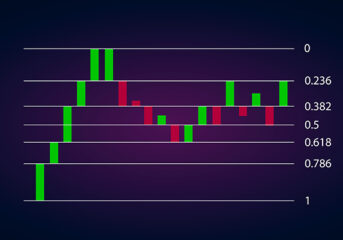 How Are Fibonacci Retracement Levels Used in Crypto Trading?Leonardo Pisano Bigollo learned the Fibonacci sequence from Indian merchants and introduced it to the Western world in 1202. This was when he designed the 'new' number system with 0. Since then, patterns and ratios in a wide range of micro and macro phenomena are understood with the help of the Fibonacci sequence. Its applications have come a long way, from studying natural phenomena to determining support and resistance levels in financial markets. Read on to learn what the Fibonacci indicator in crypto is. This guide also explains how the Fibonacci indicator can be applied to make more profitable trading decisions in the often-erratic crypto market.
 -
 How to Use Bollinger Bands for Cryptocurrency Trading?Developed in the 1980s by American asset manager and technical analyst John Bollinger, Bollinger Bands® have become an essential analytical tool in the financial markets, especially for equities. At the core, the bands reveal overbought and oversold market conditions. These conditions can provide many opportunities for traders. Now, Bollinger Bands are used extensively by digital currency traders as well. Read on to learn the fundamentals and applications of Bollinger Bands in crypto trading. This guide explains how they can help you time the market better to take advantage of the many opportunities the nascent cryptocurrency market presents.
 -
 Relative Strength Index – What is RSI, and How to Use it for Crypto Trading?Crypto traders use technical indicators like the relative strength index (RSI) indicator to determine whether a crypto asset is ‘overbought’ or ‘oversold’. Because the cryptocurrency market is incredibly volatile, technical indicators provide a way for crypto traders to plot entry and exit points.
 -
 Moving Average – Definition and Why is it Useful for Crypto Trading?The moving average (MA) is a popular technical indicator used by crypto traders to smooth out price action by filtering ‘noise from the market’ (short-term and random price fluctuations). The moving average indicator is a lagging indicator, which means that it is based on past prices. As such, it can only really be seen to confirm a pattern, not predict it. Looking to learn how to use the moving average indicator to trade crypto profitably? Keep reading!