- What is the Relative Strength Index (RSI)?
- What Does the RSI Indicate?
- How to Read the RSI Indicator?
- How Does the Relative Strength Index (RSI) Work?
- How to Use the RSI
- How to Trade Cryptocurrency with the RSI Indicator
- Calculating the Relative Strength Index (RSI) Formula
- Why is the RSI Important?
- The RSI Indicator's Advantages
- Limitations of the RSI
- Bottom Line
- FAQ
Relative Strength Index – What is RSI, and How to Use it for Crypto Trading?
Crypto traders use technical indicators like the relative strength index (RSI) indicator to determine whether a crypto asset is ‘overbought’ or ‘oversold’. Because the cryptocurrency market is incredibly volatile, technical indicators provide a way for crypto traders to plot entry and exit points.
The RSI is a momentum indicator and is used in technical analysis to determine whether a crypto asset’s price is strong or weak. If you want to learn how to use the relative strength index to trade crypto more profitably, read on.
- What is the Relative Strength Index (RSI)?
- What Does the RSI Indicate?
- How to Read the RSI Indicator?
- How Does the Relative Strength Index (RSI) Work?
- How to Use the RSI
- How to Trade Cryptocurrency with the RSI Indicator
- Calculating the Relative Strength Index (RSI) Formula
- Why is the RSI Important?
- The RSI Indicator’s Advantages
- Limitations of the RSI
- Bottom Line
- FAQ
What is the Relative Strength Index (RSI)?
J. Welles Wilder Jr.’s 1978 book, “New Concepts in Technical Trading Systems,” first introduced the definition of the relative strength index.
The relative strength index, in crypto, is an indicator that measures the magnitude and speed by which a cryptocurrency’s recent price changes. It is mainly concerned with evaluating oversold or overbought conditions in that asset’s pricing.
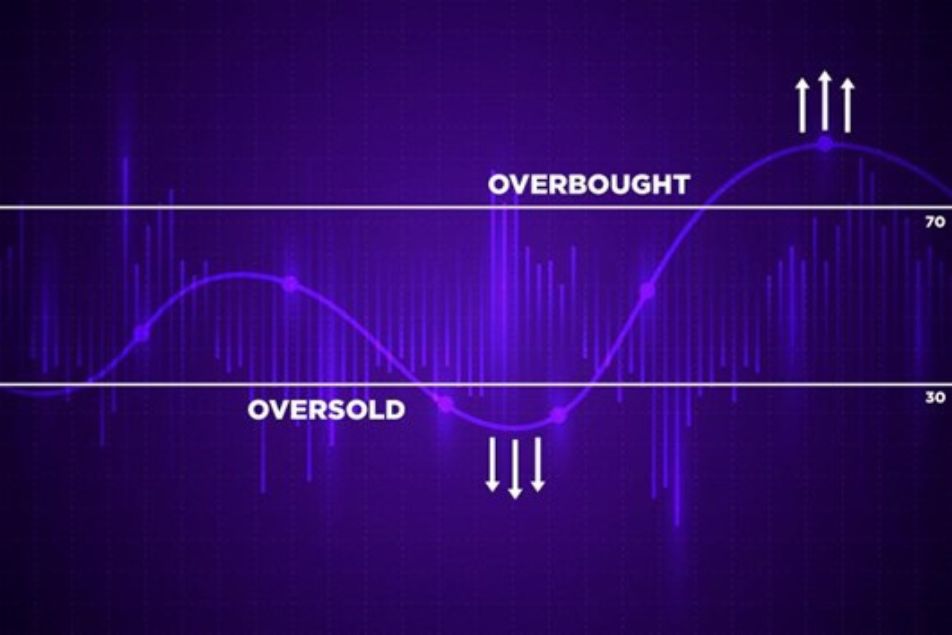
An oversold asset means that it has a market price that is less than its perceived intrinsic value. When it’s overbought, however, it means that the current price is not justified by its expected outlook. For this reason, most investors looking for short positions in overbought assets anticipate price declines.
Aside from pointing out oversold and overbought conditions, the RSI indicator can also indicate whether an asset may be due for a corrective price pullback or trend reversal. It also provides signals for when to buy and sell.
What Does the RSI Indicate?
In cryptocurrency trading, RSI indicates when an asset has hit either a bullish trend or started a bearish trend. Since the RSI is displayed as an oscillator or line graph on a scale of 0 to 100, a reading of 70 and above typically indicates overbought conditions.
On the contrary, a reading of 30 or below indicates that an asset is oversold. However, this isn’t always accurate, as false RSI signals may also occur. Because the indicator measures the magnitude of recent price movements, false signals may occur in the event of abrupt and sizable price changes.
How to Read the RSI Indicator?
Curious about how to understand the RSI indicator? Generally, values above 30 indicate oversold conditions. They also indicate a bullish trade signal, meaning that the market is about to enter an uptrend or that the asset’s price is about to rise soon.
When the RSI rises above 70, conditions are overbought and likely due to a trend reversal. This indicates a bearish signal, or that prices will likely drop soon.
During uptrends, the RSI usually stays above 30, frequently peaking at 70. During downtrends, however, the RSI dips below 70 but never exceeds 70.
How Does the Relative Strength Index (RSI) Work?
Calculating the relative strength index first requires a specific period. Typically, a default range of 14 days is used. The average gains of a cryptocurrency’s price are then divided by average losses to get the RSI value.
What is an RSI Overbought Signal?
The bullish trend is due for a correction when a crypto asset is overbought when the RSI is above 70. Traders use RSI to determine when to buy an asset during bullish trends.
What is an RSI Oversold Signal?
Meanwhile, when the asset is oversold and the RSI is below 30, the bearish trend is said to be due for a rebound. During bearish trends, traders look for selling opportunities.
What are RSI Trend Signals?
During strong uptrends, the RSI often reaches way past 70 for extended periods. During strong downtrends, the RSI typically remains at 30 or below for an extended period.
How to Use the RSI
There are several ways to use the RSI:
How to Use the RSI Based on Divergences?
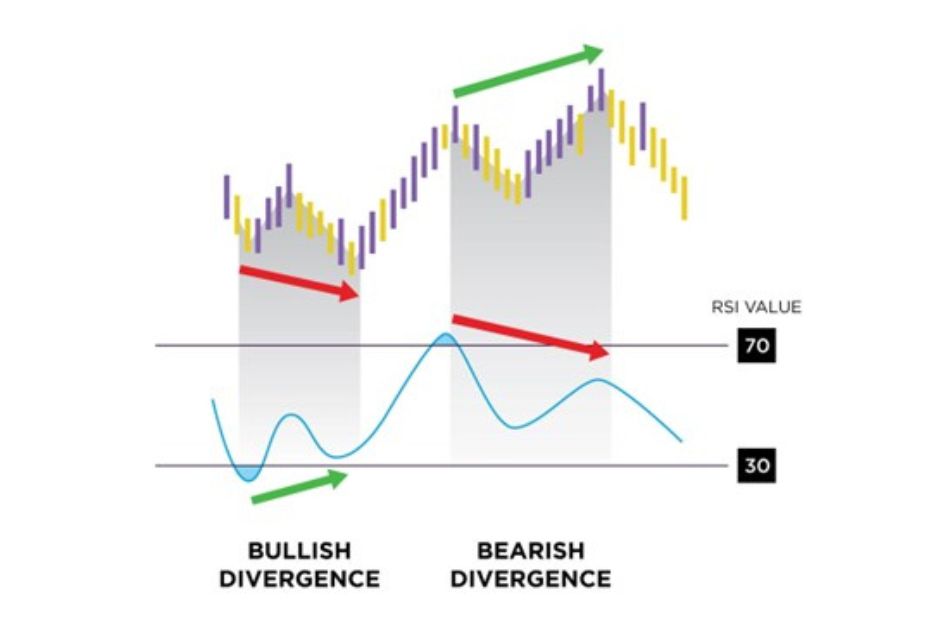
If the price chart indicates an uptrend, but the RSI indicates prices are falling, this is called a bearish divergence. This means that prices will likely start to decline. However, if the RSI indicates a downtrend while the price chart indicates otherwise, this is called a bullish divergence and indicates the potential end of a downtrend.
How to Use the RSI to Trade Trends?
First, you can modify RSI levels to fit trends. Many investors, for instance, draw a horizontal line between the 30 and 70 levels (at 50) to recognize an existing strong trend and its boundaries.
You can also use trade signals and trends that fit trends. Using bullish signals while prices are in an uptrend and bearish signals when they’re in a downtrend may help traders avert the false positives that the RSI can produce amid trending markets.
How to Trade Cryptocurrency with the RSI Indicator
Cryptocurrency traders frequently rely on the RSI Indicator as part of their trading strategy. Whenever a shift in trend is detected, it’s used to open new positions and execute trades accordingly.
For instance, if the RSI is above 50, it’s best to wait for an upward price movement to confirm the positive trend. Then, you can look for long trade opportunities. Conversely, an RSI below 50 will typically confirm a weak trend with a price decrease. You can then look for opportunities to open a short position.
The RSI can also be used to spot divergence, specifically by using it in conjunction with an instrument price line to spot future price changes.
Calculating the Relative Strength Index (RSI) Formula
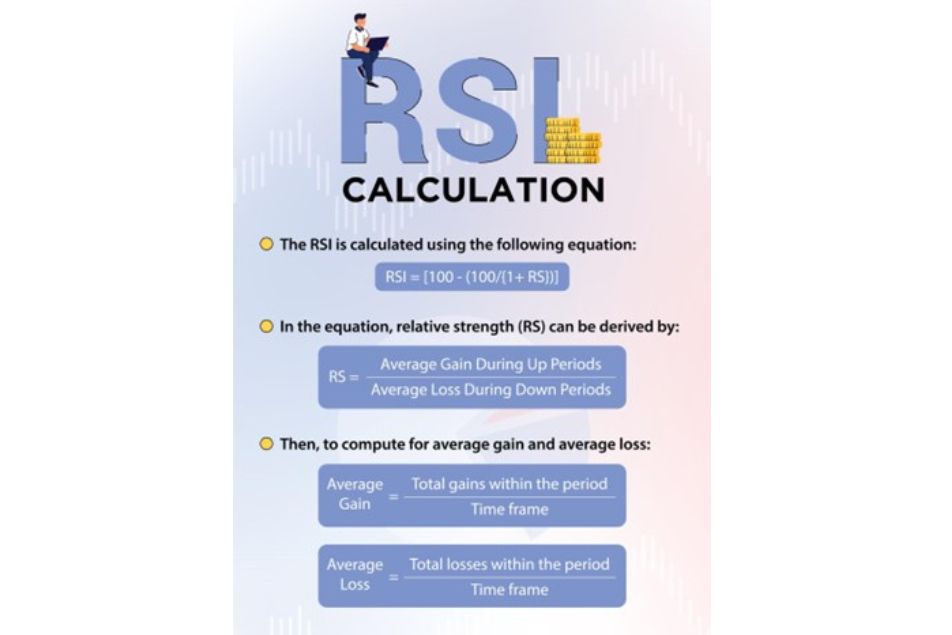
All chart software has the RSI as an inbuilt indicator, so the chances are small that you will need to calculate the RSI formula on your own. However, it can be helpful to understand the formula to better interpret the results and use the indicator alongside other analysis metrics.
The RSI is calculated using the following equation:
Why is the RSI Important?
The RSI is popular because it is widely seen as one of the most reliable technical indicators traders can use to predict a crypto asset’s price behavior. Its ability to detect shifts in trends makes it an invaluable tool for those looking to take advantage of price movements and maximize their profits in the crypto markets.
It can also help traders validate trends and trend reversals or point to overbought and oversold cryptos. Such insights can be very helpful for traders looking to enter or exit positions at the right time. The RSI can also provide short-term traders with useful buy and sell signals.
The RSI Indicator’s Advantages
The RSI offers a range of benefits:
- Easy to implement: Evaluating or setting up RSI is relatively easy once a trader has the basic information to understand it
- Effective for evaluating momentum: RSI can be invaluable when identifying where an asset’s momentum has waned
- Covers market sentiment: The RSI is a relatively reliable way to measure the market’s sentiment and provides traders with accurate indications for trading decisions
Limitations of the RSI
Here are a few of the cons associated with using the RSI:
- Possibility of inaccurate market representation: Oversold and overbought ranges are complex, making misinformation inevitable to a certain degree
- Loss of reference value near the middle line at 50: It might be confusing when the RSI of any cryptocurrency is between 60 and 40 values
- Instances of false alarms: True reversal signals are quite rare, making them difficult to distinguish from false alarms
The Bottom Line
Overall, the RSI is a powerful and versatile tool that can be used by traders to analyze market trends, identify trading opportunities, and make informed decisions.
While it does come with some limitations, such as the possibility of inaccurate market representation or false alarms, these issues can be overcome with proper research and careful analysis.
Whether you are a beginner or an experienced trader, the RSI can help you navigate the crypto markets successfully and profitably. So, if you are looking for an effective indicator to boost your trading performance, consider using the RSI as a technical indicator in your crypto trading.
FAQ
-
Is the RSI indicator reliable?
Yes, the RSI is one of the most reliable crypto indicators, according to crypto traders.
-
Does the RSI indicator work for crypto?
Yes, the RSI indicator is commonly used to effectively analyze price trends in crypto.
-
What does RSI indicate in crypto?
The RSI can be used to identify overbought and oversold conditions in crypto assets.
-
Is the RSI the most accurate indicator for crypto?
Yes, the RSI is one of the most reliable indicators for analyzing market trends in cryptocurrencies.
-
How do you set the RSI indicator on crypto?
You will find the RSI indicator within almost every charting software package. Just select the indicator and change the default 14-period setting if you wish.
-
Should I buy when the RSI is low?
A low RSI value may indicate a strong bearish trend, or oversold conditions possibly with a bearish divergence. You will need to determine whether it is the latter or the former. If it is the latter, then it can be a buy signal.
-
What is a good RSI number?
It depends on your strategy. Typically, using an oversold/overbought strategy, values below 30 generate buy signals, and values above 70 generate sell signals.
-
What is a bad RSI number?
There is technically no bad RSI number, as the values generate signals that provide opportunities to buy or sell.
-
What happens when the RSI is high?
A high RSI either means that an asset is overbought, and its price may drop soon, or that there is a strong bullish trend which is more likely than not to persist.
-
What does a low RSI mean?
A high RSI either means that an asset is oversold, and its price may rise soon, or that there is a strong bearish trend which is more likely than not to persist.


