- What is the Moving Average (MA)?
- How to Calculate a Moving Average?
- What Does a Moving Average Indicate?
- What are Moving Averages Used For?
- How to Use Moving Average Indicators in Crypto Trading?
- When Should a Moving Average be Used?
- Simple Moving Average (SMA) Vs. Exponential Moving Average (EMA)
- EMA Vs. RSI
- EMA Vs. ADX
- Moving Averages Pros and Cons
- Conclusion
- FAQ
Moving Average – Definition and Why is it Useful for Crypto Trading?
The moving average (MA) is a popular technical indicator used by crypto traders to smooth out price action by filtering ‘noise from the market’ (short-term and random price fluctuations).
The moving average indicator is a lagging indicator, which means that it is based on past prices. As such, it can only really be seen to confirm a pattern, not predict it.
Looking to learn how to use the moving average indicator to trade crypto profitably? Keep reading!
- What is the Moving Average (MA)?
- How to Calculate a Moving Average?
- What Does a Moving Average Indicate?
- What are Moving Averages Used For?
- How to Use Moving Average Indicators in Crypto Trading?
- When Should a Moving Average be Used?
- Simple Moving Average (SMA) Vs. Exponential Moving Average (EMA)
- EMA Vs. RSI
- EMA Vs. ADX
- Moving Averages Pros and Cons
- Conclusion
- FAQ
What is the Moving Average (MA)?
The moving average is a technical indicator that can help traders identify a trend and make informed trading decisions. For instance, when a cryptocurrency’s price is above its 50-day moving average, it suggests that the buyers are more active than the sellers. This means that MA traders can disregard selling opportunities and focus on buying the crypto asset.
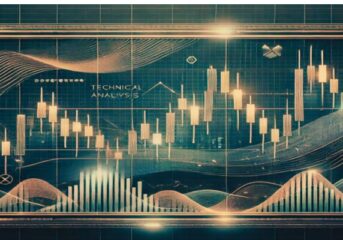
The moving average is depicted as a dynamic line in a price chart. In the illustration below, the MA is the golden line moving alongside the candlesticks:

How to Calculate a Moving Average?
The moving average is calculated by summing up all the data points during a specific period, then dividing the sum by the number of time periods.
The formula is as follows:
Moving Average = C1 + C2 + C3…Cn / N
In the formula above, C1 (up to Cn) refers to an instrument’s closing prices, and N refers to the number of periods for which the average is being calculated.
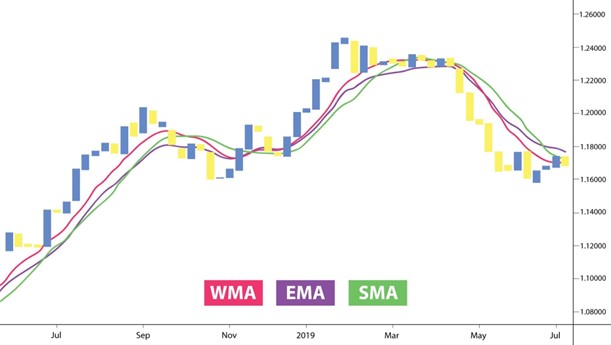
There are three types of moving averages popular in crypto:
- Simple Moving Average (SMA)
- Exponential Moving Average (EMA)
- Weighted Moving Average (WMA
Simple Moving Average
The SMA calculates a cryptocurrency’s average price for a specified period. The MA only shows the average price, SMA shows all the data in a dynamic line.
Exponential Moving Average
The EMA is like SMA in that they both track trend direction. It places more weight on recent price changes, providing potentially more accurate price insights.
Weighted Moving Average
The WMA puts less emphasis on previous data and more on recent prices. Since all the numbers on SMA are of equal weight, WMA is deemed more reactive to recent patterns.
What Does a Moving Average Indicate?
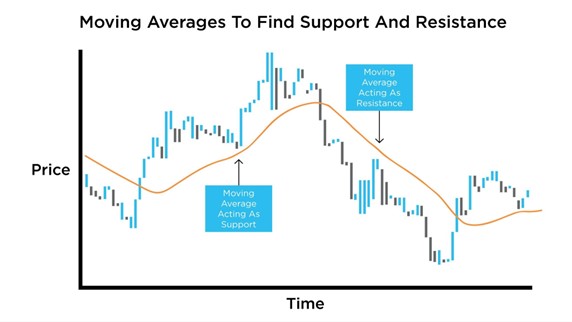
The MA helps determine important support and resistance levels, thereby identifying the direction of a trend. The support level is where the price usually stops falling and bounces back up, while the resistance level is where the price typically stops rising and dips back down.
When a cryptocurrency’s MA is rising, it points to an uptrend. Conversely, if it decreases over time, this indicates a downtrend. The MA is called a “moving” average because it undergoes continual recalculation based on recent price data within a specific timeframe
Crypto analysts and investors use the gathered data to forecast an asset’s price trajectory. It is a lagging indicator since it follows the underlying asset’s price before producing trading signals or displaying the direction of given trends.
What are Moving Averages Used For?
Traders monitor MAs typically spanning over 50, 100, or 200 days. Significant trading signals often arise when the 50-day and 200-day moving averages are breached in either direction.
When a faster MA measurement crosses above a slower MA, it is a bullish signal and indicates the trend is likely to continue. Conversely, when a faster MA crosses below a slower MA, it is a bearish signal that suggests the price may start declining.
MAs are also used as indicators to watch for occurrences that indicate strong trend reversals, such as the golden cross and the death cross. The golden cross occurs when a 50-day MA crosses over a 200-day MA. The death cross happens when a 50-day MA crosses below a 200-day MA.
How to Use Moving Average Indicators in Crypto Trading?
The use of moving averages in crypto is common because it is a simple analysis traders can do quickly on most trading platforms. By tweaking the calculation method and period, multiple MAs can be added. Also, there are other ways moving averages can be used in crypto analysis:
Support and Resistance
A moving average usually acts as a form of support and resistance. Like most indicators, stronger support or resistance levels can be expected with longer time frames.
Slopes
Examining the slope of a moving average on an extended timeframe can assist you in determining the direction of a trend. If it is pointing upwards, this suggests that your target instrument is currently experiencing an uptrend. If it looks to be trending downward, then your market is in a downtrend.
Moving Average Crosses
Trading moving average crosses is another well-known technique for traders. To use this strategy, it is necessary to have two or more moving averages on your charting software, with one longer than its counterpart, for optimal use.
When Should a Moving Average be Used?
Technical analysts commonly use moving averages to determine whether a change in momentum is occurring for a trading pair, such as if there is a sudden upward trend in a cryptocurrency’s price. In some instances, traders use moving averages to confirm their suspicions about an impending change in momentum.
MAs are also commonly used with time series data to highlight long-term cycles and trends, and to ‘smooth out’ short-term minor fluctuations in price. In such instances, the parameters of the MAs will be adjusted accordingly, and the threshold between short-term and long-term trends will depend on the application.
Simple Moving Average (SMA) Vs. Exponential Moving Average (EMA)
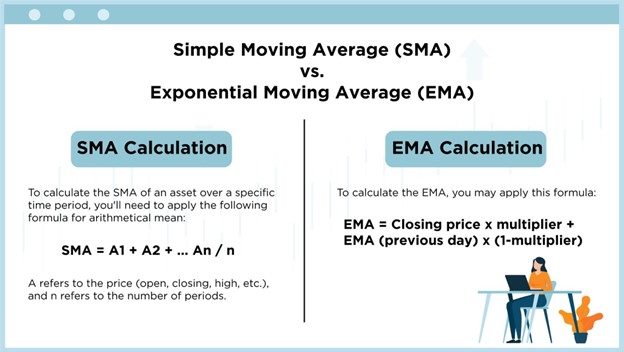
As mentioned earlier, the SMA and EMA are two of the best moving averages for crypto trading. They vary in terms of calculation. While there is no need for you to manually compute these, a cursory understanding of how the values are computed is beneficial in crypto trading. Let us examine how each MA is computed:
EMA Vs. RSI
The Relative Strength Index (RSI) differs from the exponential moving average indicator in that it is a technical oscillator that identifies whether the market is ‘overbought’ (buyers have run out of steam) or ‘oversold.’ The RSI indicator fluctuates from 0 to 100:
- 0-30: The price is oversold
- 70-100: The price is overbought
An RSI above 30 is typically a strong indication that the market is about to start a bullish trend. Traders can use this in conjunction with the EMA. A potential buying opportunity may arise, for instance, if the RSI is bullish while the price is increasing from the dynamic 20 EMA.
EMA Vs. ADX
The average directional index (ADX), like the MA, is a momentum indicator that assists traders in recognizing the strength of a trend. When trading cryptocurrency, investors must pay close attention to the ADX level, which fluctuates from 0-100 and beyond. Keeping track of this indicator is critical to trading a successful buy position.
As such, traders who wish to open a buy/long trade using the EMA and ADX should:
- Ensure that the price moves above an important support level with no strong resistance near the entry price
- Monitor that the ADX is moving upward and crossing above 20
- Spot the long-term trend with the 200 SMA and the short-term trend with the 20 EMA
Moving Averages Pros and Cons
Technical market analysis can be made simpler by using moving averages, which can highlight price trends and smooth out data for a more straightforward visual clue. Moving averages are particularly fit for illustrating on price charts and other indicators. Plus, they provide additional benefits such as:
- Can be used to forecast cryptocurrencies with constant demand and where there is a subtle trend or rangebound
- It can be used to separate random variations
- Identifying areas/levels of support and resistance
- Simple application and interpretation allow for several varying MA lines to be plotted at the same time for comparison
The MA indicator also has some drawbacks, which include:
- The need to maintain a history of different time periods for each forecasted period
- The tendency to overlook more complex relationships within the data
- The failure to respond to fluctuations that may take place due to cycles and seasonal impacts
Conclusion
The cryptocurrency market provides many opportunities for traders to make profitable trades.
Before investing in a crypto asset, however, it is essential for traders to assess the current wider market trend and fundamentals, as this will significantly impact their chances of success in a trade.
Moving averages are particularly helpful in predicting changes and understanding prevailing trends, thereby essential for making informed trading decisions. Much like other indicators, however, MAs are fallible and would still benefit from additional market data and insights from other indicators as an overlay.
FAQ
-
Is the moving average indicator profitable?
Yes, the MA can provide insights that lead to profitable trades.
-
Is the moving average a good indicator?
Yes, the MA is considered one of the most reliable technical analysis indicators if used correctly.
-
How to read the moving average indicator?
The MA appears as a dynamic line on a price chart and can be interpreted as either bullish or bearish.
-
Do moving averages work for crypto?
Yes, MAs can be effectively used in crypto trading.
-
Which moving average is best for cryptocurrency?
The EMA is considered an excellent moving average for crypto analysis as it gives greater weighting to the most recent prices.
-
What is the daily moving average in crypto?
The daily moving average in crypto displays the arithmetical mean of an asset’s daily prices over a period.
-
When should I use a moving average?
You can use a moving average to help identify trading opportunities and forecast trends in the crypto market.

