What is Moving Average Convergence Divergence (MACD) Indicator?
Moving Averages Convergence Divergence (MACD) is an extremely popular indicator used by traders across a wide range of financial instruments. It has gained the attention of crypto traders over the past few years. This guide to the MACD indicator explains what its various components are, how to read it and what to make of the signals generated by it.
What is the MACD Indicator?
Developed by Gerald Appel in the 1960s, MACD is a technical indicator that is very popular among traders because of its ease of application and interpretation on price charts. It compares two different moving averages of an asset’s price to generate trading signals. Traders mostly use exponential moving averages.
Moving Average Convergence/Divergence – Definition Explained
A moving average is the average change in a data series over a certain period. This helps to identify the pattern an asset’s price has been following over a timeframe, which could be a few hours or days. Every time the price fluctuates, the average is recalculated, which is why it is called a “moving” average.
Mostly, the exponential moving average (EMA) is used in the MACD indicator. The EMA is a type of moving average (MA) that gives greater weight to the more recent price points.
Convergence and divergence are calculated with exponential moving averages of different durations. When the lines formed by the EMAs meet at a price, it is called known as convergence. When the two move away from each other, it is known as divergence.
MACD Calculation

The MACD is the difference between two EMAs. It is plotted below the price chart with zero as baseline and the MACD oscillating above and below this. The 12-day and 26-day EMAs are most often used. The difference between these two is taken to plot the MACD line.
The MACD is said to be positive when it is above the baseline, which is also known as the centreline. This takes place when the 12-day EMA is higher than the 26-day EMA. MACD is said to be negative when it is below the baseline, which is what happens when the 12-day EMA is lower than the 26-day EMA.
For convergence and divergence, the MACD line is compared with the Signal line, which is mostly the 9-day EMA.
MACD Formula
Traders can choose EMA periods to match their trading strategy. However, the standard MACD indicator uses the 26-day EMA and 12-day EMA.
- Formula to calculate the MACD line: 12-Day EMA − 26-Day EMA (difference between the two)
- Formula to calculate the Signal line: 9-day EMA of the MACD line.
- Formula to calculate the MACD Histogram: MACD line – Signal line (difference between the two)
How to Read the MACD Indicator
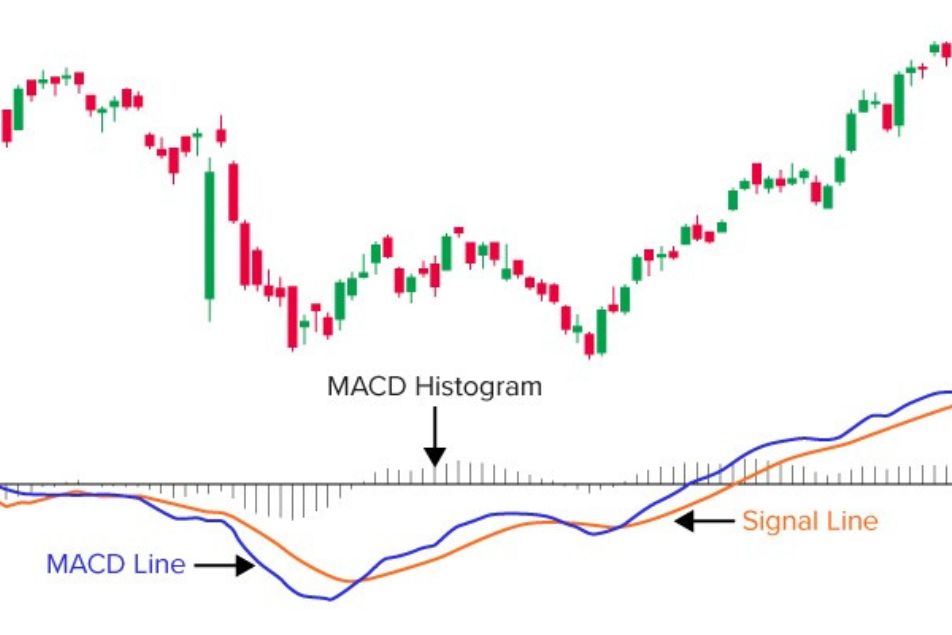
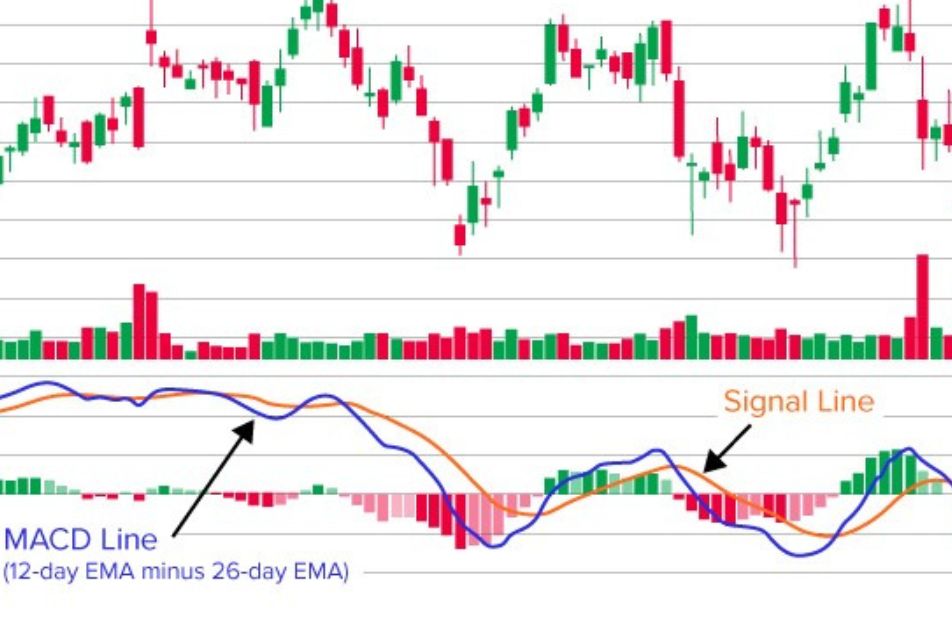
The MACD indicator has three parts:
MACD line: This is generated by subtracting the longer (26 period) exponential moving average from the shorter (12 period) one.
Signal line: This is the 9 period EMA of the MACD.
Histogram: It is a graphical representation of difference between the MACD line and Signal line and shows the convergence and divergence of the two.
What Does MACD Convergence Show?
When the MACD lines move closer, it shows that the price momentum is losing strength.
What Does MACD Divergence Show?
When the MACD lines move away from each other, it indicates that the price momentum is gaining strength.
How to Read a Potential MACD Buy Signal
When the MACD line crosses the 9-day EMA from below, it is considered a buy signal.
How to Read a Potential MACD Sell Signal
When the MACD line cross the 9-period EMA from above, it is a potential sell signal.
How to Read MACD Moving Average Crossovers
Signal line crossovers are the most used MACD trade signals. They can be used to identify oversold or overbought conditions, confirm an ongoing trend, and check if there is enough momentum for the trend to continue.
How to Use Moving Average Crossover to Spot Buy Signals
Buy signals are generated when the MACD line crosses the Signal line from below. This is why it is called a bullish crossover.
How to Use Moving Average Crossover to Spot Sell Signals
Sell signals are generated when the MACD line crosses the Signal line from above. This is called a bearish crossover.
The Slope of the MACD Histogram
A change in the slope of the MACD Histogram can be an early signal of potential trend reversal and price swings. This is among the most overlooked signals. Zeroes in the Histogram are buying or selling signals. When a bearish or bullish momentum weakens, peaks and troughs show up in the Histogram. It is almost always neglected, as it often generates false signals during ranging markets where the momentum catches up and falls back often without significant price swings.
Example of MACD Crossover
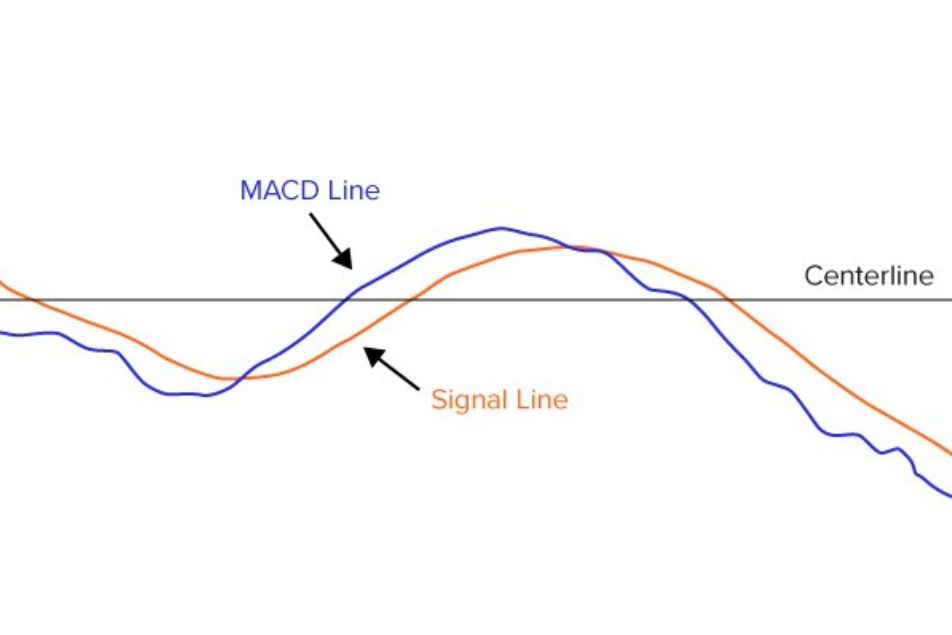
MACD can crossover either the Signal line or the centreline.
During a Signal line crossover, the Histogram shifts from negative to positive. It indicates a shift in trading momentum. Although crossovers can last for multiple periods, they are the strongest indicators at the inflection points.
A centreline crossover indicates strengthening momentum in one direction. A crossover of MACD from the negative to the positive side indicates strength in upward momentum and a crossover from negative to positive shows an increase in downside momentum.
Example of Divergence
Divergence is an indicator of momentum building up or wearing off, irrespective of price action. Although the MACD indicator shows both convergence and divergence, it is the latter that is more significant for traders. MACD divergence occurs when the MACD and the Signal line diverge after a crossover. It is considered a strong reversal signal when:
- A bullish divergence occurs when the price of the assets creates two falling lows and MACD creates two rising lows.
- A bearish divergence occurs when two falling highs formed by the MACD are accompanied by two rising highs of the price action.
How to Use the MACD Indicator in Crypto Trading
The MACD indicator generates many signals. It is important for traders to identify the stronger ones. This can be done by confirming the signals. For instance, a strong bull signal is one that has the following components:
- A bullish divergence
- Bullish Signal line crossover
- Bullish centerline crossover
- Rising MACD
As with any indicator, the MACD should be used together with another indicator to confirm the signals before taking any action in the live market.
MACD Line and MACD Signal Line
Signal Line Crossovers are the Most Used MACD Trade Signals
Most MACD traders look for crossovers of the signal line to generate a trade entry. A crossover happens when the histogram moves from negative to positive, or from positive to negative, territory. This signal is very similar to the relative strength index (RSI) crossover of the 50. A bullish crossover shows you that bulls are having the edge over the look back period; a bearish crossover shows you the opposite.
MACD Centerline Crossovers – Least Used Signal (Belated)
Some MACD traders look for a crossover by the signal line as a signal to buy or sell. However, it is wise to not take every signal, especially in choppy conditions. This signal is best used following a move down within a bullish trend, after which the price bounces back and generates a crossover of the center line. Or when the same thing happens but in reverse during a bearish trend.
MACD Divergence – Good for Spotting Potential Reversals
Divergence is what happens when the MACD looks bullish but the price action in the chart looks bearish, or the other way around. To identify and assess these signals, you need to have some experience in interpreting price action. When you see this kind of divergence, it is often an indicator of a strong reversal, and you should usually follow the lead of the price action. This can be an excellent trade entry signal, but it takes some practice to master.
Slope of MACD Histogram – Earliest Signals, Most Underrated
An even more challenging signal that can be generated from the MACD indicator is when the histogram slope changes dramatically. For example, the histogram might look strongly bearish, but then it becomes less so, and the slope starts to turn upwards, even though the indicator is still bearish. This could be interpreted as a bullish signal.
Just like MACD divergence, this is not the type of signal you want to be taking every time it happens – you will need some practice to learn to identify when significant histogram slope changes happen because the histogram slope changes often and can generate a lot of false signals.
Pros of Using the MACD
MACD has gained acceptance for the many advantages it offers when trading cryptocurrencies:
- It is easy to use and interpret.
- It considers the bigger picture and not just the immediate price action.
- It is easy adaptable, as traders can set the EMA durations of their choice.
- It excels in volatile crypto markets.
- It can be used both as a trend and momentum indicator.
- MACD crossover and divergence help predict potential buy-and-sell signals.
- Since it is below the price action chart, it can be used easily with other indicators to build a powerful trading strategy.
Cons of Using the MACD
Like all other technical indicators, the MACD has a few shortcomings:
- It cannot clearly indicate an overbought or oversold asset condition.
- MACD divergence does not predict smaller price reversals. It can only predict the larger ones and misses many smaller trading opportunities.
- MACD divergence can generate false reversal signals.
- It can become ineffective in range-bound markets.
Bottom Line
MACD is quite popular among cryptocurrency traders as it gives a more comprehensive view of the market. It packs in a lot of information and shows it in an easily understandable manner. However, experienced traders always use MACD with other indicators, as it is prone to generating false signals.
FAQ
-
Is the MACD a reliable indicator?
MACD is a great indicator in trending markets. However, it does generate false signals and it would be a mistake to rely solely on this indictor to make all trading decisions.
-
Is the MACD a leading indicator or a lagging indicator?
MACD is a lagging indicator, although traders can use the Histogram to predict trend continuation and reversal.
-
Does crypto have the MACD indicator?
Yes, you can use the MACD indicator for trading cryptocurrencies. It is available free on MT4 and MT5 trading platforms. You can even set up alerts for when the MACD crosses the centreline or the Signal line.
-
Is MACD a good indicator for crypto?
Yes. Since the crypto market is highly volatile, MACD is a popular indicator to identify the strength and direction of the current momentum.
-
Do professional traders use MACD?
Professional traders do use MACD. It is popular for its simplicity and adaptability. Some pros use slower MACDs (19, 39, 9 EMAs, instead of the 12, 26, 9 EMAs) to trade volatile assets like cryptos. However, this is used only to exit their trades, rather than to generate entry signals.
-
What is the success rate of the MACD indicator?
While the MACD shows information in an easy-to-understand way, it does not have a very high success rate when used alone. It does not generate overbought and oversold signals and can be paired with a volume-based indicator to increase the success rate of your trading strategy.
-
How do you use the MACD indicator effectively?
To effectively use the MACD, keep your eyes on potential crossovers. When the MACD line crosses from below the Signal line, it is a bullish signal. The further below the centreline it lies, the stronger the signal. When the MACD line crosses the Signal line from above, it is a bearish signal and the further above the centreline it lies, the stronger is the signal.
-
What are the three numbers in the MACD indicator?
- The difference between the slower and faster moving average (usually taken as the difference between the 12-day and 26-day EMA)
- The Signal line (usually taken as the 9-day EMA)
- The Histogram (difference between MACD line and Signal line)
-
What is the best timeframe for the MACD indicator?
The most popular timeframes for the MACD are 12, 26 and 9. The MACD line plotted as the difference of the exponential moving averages of the 12-day and 26-day EMAs, while the Signal line is taken as the 9-day EMA.
-
What is the difference between the MACD and RSI indicators?
Relative strength indicator is a momentum oscillator and highlights the oversold and overbought conditions. This is something the MACD cannot identify. The MACD shows the strength and direction of the current momentum.
-
Is the MACD better than the RSI?
The MACD and RSI highlight different aspects of market behaviour. This is why many seasoned traders use these two indicators together to get a comprehensive view of the market and to confirm signals.
-
What is a MACD bullish/bearish divergence?
An MACD bullish divergence shows that there is enough momentum for the uptrend to continue, while the bearish divergence indicates that the current bearish trend might continue.


