- What is a Fibonacci Retracement?
- Understanding Fibonacci Numbers
- What Do Fibonacci Retracement Levels Tell You?
- Using Fibonacci Numbers to Trade Crypto
- How to Set Up and Draw Fibonacci Retracement Levels?
- Using Fibonacci Retracement Levels
- Fibonacci Trading Strategies with Crypto Example - Using Fibonacci to Trade In-Trend (Downtrend)
- How to Use Fibonacci Retracement Depends on Your Crypto Strategy
- Fibonacci Retracements vs. Fibonacci Extensions
- Limitations of Using Fibonacci Retracement Levels
- Final Thoughts
- FAQ
How Are Fibonacci Retracement Levels Used in Crypto Trading?
Leonardo Pisano Bigollo learned the Fibonacci sequence from Indian merchants and introduced it to the Western world in 1202. This was when he designed the ‘new’ number system with 0. Since then, patterns and ratios in a wide range of micro and macro phenomena have been understood with the help of the Fibonacci sequence.
Its applications have come a long way, from studying natural phenomena to determining support and resistance levels in financial markets. Read on to learn what the Fibonacci indicator in crypto is. This guide also explains how the Fibonacci indicator can be applied to make more profitable trading decisions in the often erratic crypto market.
- What is a Fibonacci Retracement?
- Understanding Fibonacci Numbers
- What Do Fibonacci Retracement Levels Tell You?
- Using Fibonacci Numbers to Trade Crypto
- How to Set Up and Draw Fibonacci Retracement Levels?
- Using Fibonacci Retracement Levels
- Fibonacci Trading Strategies with Crypto Example – Using Fibonacci to Trade In-Trend (Downtrend)
- How to Use Fibonacci Retracement Depends on Your Crypto Strategy
- Fibonacci Retracements vs. Fibonacci Extensions
- Limitations of Using Fibonacci Retracement Levels
- Final Thoughts
- FAQ

What is a Fibonacci Retracement?
Retracement analysis is a mechanism to identify the price levels at which the market tends to retrace before continuing in the original direction of movement. The goal of retracement analysis is to find support and resistance levels where the breakouts (in the trend) or bounces (reversals) may occur. The retracement idea applies to many indicators, such as Tirone levels and Gartley patterns. However, it is most used with the Fibonacci indicator in crypto trading.
Understanding Fibonacci Numbers
To begin with the Fibonacci indicator, a trader must first understand the Fibonacci sequence and associated ratios.
The Fibonacci Sequence
0, 1, 1, 2, 3, 5, 8, 13, 21…
The two starting numbers of the series are 0 and 1. All the subsequent numbers are a result of adding the previous two numbers. For instance,
8 = 5 + 3 and 21 = 13 + 8
The Golden Ratio
The ratio of two consecutive numbers in the sequence is approximately 0.618, which means that each number is about 1.618 times bigger than the previous number. This ratio is in our DNA, petal formation of flowers, the hurricane patterns, and almost everything around us! Hence, its name – the Golden Ratio or the divine proportion. You’ll learn how the ratio is paramount for the Fibonacci analysis of cryptocurrency shortly.
What Do Fibonacci Retracement Levels Tell You?
If you are wondering how to calculate the Fibonacci retracement levels, you can do so by taking high and low points on a chart and marking the key Fibonacci ratios horizontally to produce a grid.
Identifying the Retracement Levels
The Fibonacci retracement levels, also known as key levels, occur at the Fibonacci ratios or percentages.
Level 1
The ratio between two adjacent numbers is approximately 0.618. The corresponding retracement level is 61.8%.

Level 2
Similarly, the ratio between every other number of the sequence is 0.382 and the corresponding retracement level is 38.2%.

Level 3
Consider the ratio of every third number in the sequence. It’s 0.236. So, the associated retracement level will be 23.6%.

Level 4
The fourth and final level is 78.6%, or 0.786, which is the square root of 0.618, our first key level.
Note:
The ratio of the second and the third Fibonacci numbers – 1 and 2 is 0.5 and the corresponding percentage is 50%. This is also used while marking retracement levels. However, some analysts consider it a violation of the Fibonacci sequence as this ratio does not repeat itself like others.
How Does the Fibonacci Indicator Work?
These percentages decide where the horizontal lines are drawn between the two price points under consideration. Every horizontal line of the grid is a possible pivotal point of price action. The one used to open positions is decided according to market conditions, price direction, and mass sentiment.
Using Fibonacci Numbers to Trade Crypto
Fibonacci numbers are used to identifying retracement levels in terms of percentages, between any two given price points. These are static levels between the high and low anchor points used to plot the grid. The static nature allows quick and easy identification and helps traders to act prudently when any two price levels are tested. The points of intersection of these levels with trend lines are called inflection points, where interesting price action can be expected.
How to Set Up and Draw Fibonacci Retracement Levels?
While using the Fibonacci indicator in crypto technical analysis, each retracement is a derivative of the vertical ‘trough to peak’ distance between the price points under consideration. The distance is divided into zones defined by the Fibonacci ratios to make the horizontal retracement levels.
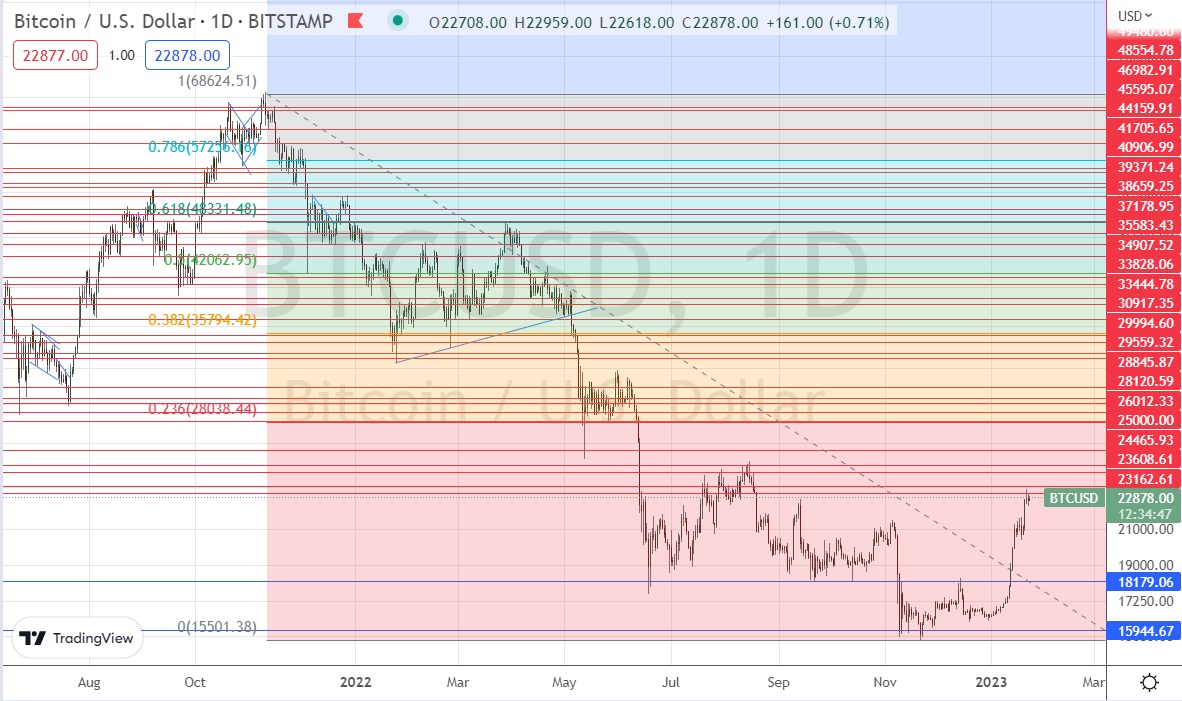
Consider the below image of a downward-trending market in Bitcoin. Here, 0 is high at the starting price level of $68,624, and 1 is the low price point at $15,501. The first Fibonacci retracement level of 23.6% at $28,038 has not yet been reached.

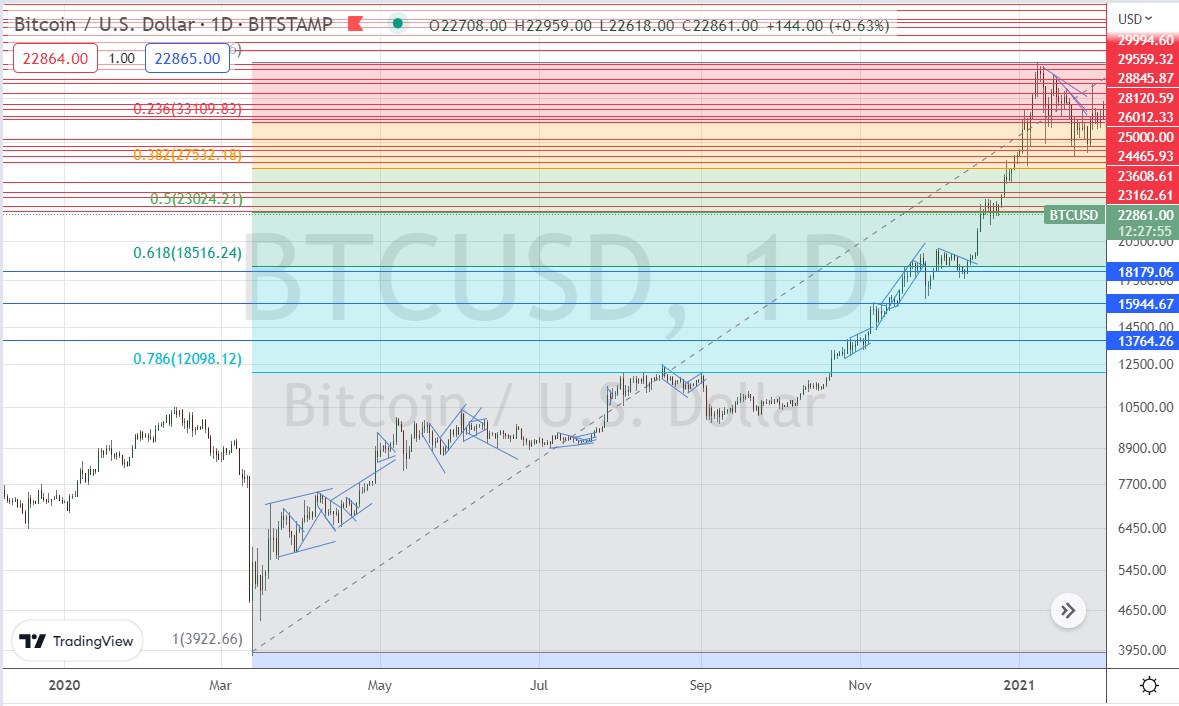
When plotting an uptrend, 0 is low and 1 is high, as shown in the below image:

Note that the horizontal lines or the retracement levels are the Fibonacci percentages starting from 0, in both the cases.
Using Fibonacci Retracement Levels
The way you apply retracement indicators to your chart and the combination of indicators you choose with it, moving averages, Bollinger Bands, or any other, dictates where you set your stop loss and take profit limits. Additionally, whether you choose to trade with the trend or against it, helps you identify the entry and exit points. Here are some strategies for using the Fibonacci indicator explained:
Fibonacci Support Trading Strategy
Identifying support levels means attempting to predict where the price may end up retracing or land after reaching the peak and reversing from there. This helps us to identify buy points. In this case, 1 is the swing low, while 0 is the swing high. All retracement levels are potential support levels.
Fibonacci Resistance Trading Strategy
Predicting resistance levels means identifying where the price may come back after hitting the bottom. Here, 1 is the swing high, while 0 is the swing low. Each retracement level is a potential resistance where a reversal may happen. These are potential sell points. The likelihood of a reversal increases if there is a confluence of technical signals when the price reaches a Fibonacci level and other signals are used.
Steps to Use the Fibonacci Retracement Tool to Trade Cryptocurrency
Below are the steps for using Fibonacci in crypto trading:
Step 1
Find a completed trend. Fibonacci can be applied to an uptrend as well as a downtrend. A timeframe of 5 to 15 minutes is popular among day traders.
Step 2
Place the Fibonacci retracement tool on the chart to draw the lines in the direction of the completed trend.
Step 3
Observe the price to wait for a reversal at or very near to one of the key levels. Focus on these price levels and use market sentiment, news updates, and additional indicators to predict price action at one of the levels.
Step 4
Enter the trade in the direction of the original trend. A retracement of an uptrend means prices will correct lower. Consider timing your entry into a bullish trade near one of the key levels. It is better to wait for the price to break higher before entering long positions.
Fibonacci Trading Strategies with Crypto Example – Using Fibonacci to Trade In-Trend (Downtrend)
Consider this example within a downward-trending market. Each retracement level acts as a potential point of price reversal or a breakout. For instance, take the price level 0.010075 or the 61.8% level. If you projected the price to break out and decline further, you would have opened short positions when the price reversed from the high swing (0). The take profits would be set at one of the traced levels (38.2%, 0.5%, or 78.6%) based on your predictions. Stop loss is at 23.6% (0.012022), to manage risk if the market moved against prediction (reversed).
How to Use Fibonacci Retracement Depends on Your Crypto Strategy
You can use the Fibonacci levels to identify areas to trade reversals or breakdowns, depending upon your strategy. Let’s say the price of a crypto that was rising has just fallen. If your strategy is to trade a reversal, you can wait for the price to reverse at one of the Fibonacci levels. However, if your strategy is based on determining that the price will continue to decline, you could wait for the price to breach one of the Fibonacci levels and then enter a trade in the direction of the retracement.
Fibonacci Retracements vs. Fibonacci Extensions
Fibonacci retracements apply percentages to pullbacks, whereas Fibonacci extensions apply percentages to a further move in the direction of the trend. The extensions are the exit positions where the price breaks out of the trend beyond 100%. These ratios are obtained by adding the usual ratios to 1 and not 0. Therefore, the new ratios become – 1.236, 1.382, 1.5, 1.618, and so on. It’s a measure of how far the trend may continue beyond the anchor points.
Fibonacci extensions help traders to identify price targets in case the price breaks down the support line in a downtrend. The trader can open short positions once the trend has broken down the support, with targets at 1.236 and 1.382. In case of a bounce back, a trader can buy the crypto again and take advantage of the price swing toward the previous retracement level.
Limitations of Using Fibonacci Retracement Levels
Firstly, Fibonacci retracement levels are static, which means every time the price breaks beyond anchor points, the indicators are required to be set up again. However, today there are advanced tools to do this, and no manual effort or time is lost.
Secondly, using the Fibonacci indicator in crypto does not guarantee a retracement or an extension. Most traders use additional indicators to identify the exact level of a breakout or a reversal.
There are traders who argue that since the Fibonacci sequence is infinite, the number of retracement levels can also be infinite, and so a price action will occur near one of them. However, with experience, traders develop their strategies with a set of limited retracement levels and combine them with other indicators to make trading decisions.
The Fibonacci indicator is a popular cryptocurrency trading tool. It is easy to understand and apply. The only thing traders need to keep in mind is that the tool must be used in combination with other indicators to find the few trade opportunities where an edge truly exists.
Final Thoughts
Crypto prices rarely move in a straight line. Even in an uptrend, there will be a few rises, and some retraces, while the crypto continues to move up. The Fibonacci retracement tool is used by crypto traders to check for possible sections where a pullback may find support or resistance. These support and resistance levels can help traders know where to enter, identify stop-loss levels, and set price targets. Although Fibonacci retracements are useful, they are widely considered a confirmation tool. That means it’s best to use it to confirm what you may have deduced using other technical indicators.
FAQ
-
Is Fibonacci trading good?
Fibonacci trading is good but not usually sufficient as a standalone indicator. It is at the trader’s discretion to use it with other indicators according to their trading strategies and identify favourable entry, exit, stop loss, and target price points.
-
Is Fibonacci retracement a good strategy?
Fibonacci retracement is a strategy that has helped many traders. The crypto trading community uses it for its convenience and straightforward application. Also, it is easy to combine with other technical indicators.
-
What are the best Fibonacci levels?
The most used Fibonacci levels are set at percentages 23.6%, 38.2%, 50%, 61.8%, and 78.6%.
-
Does Fibonacci work with crypto?
Yes, the Fibonacci indicator is useful for traders to identify support and resistance levels within crypto price charts. However, other indicators such as moving averages, Bollinger Bands, and volume indicators are used to identify entry and exit points for trading positions. Market conditions, trader sentiment, and other factors should also be considered.
-
How do you read Fibonacci in Crypto?
A Fibonacci crypto chart is created by placing the Fibonacci indicator on the chart of a cryptocurrency and adjusting the timeframe to fix the anchor points. After this, horizontal lines are drawn to mark the retracement levels at Fibonacci percentages.
-
How accurate is Fibonacci retracement in Crypto?
Some experts believe that the Fibonacci indicator works with 70% accuracy, with certain specific price points. The accuracy depends on your choice of price points.
-
Does Bitcoin follow Fibonacci?
Although Bitcoin has shown conformance to Fibonacci retracement levels, there is no guarantee that this will always be true. In many instances, Bitcoin’s performance has disagreed with Fibonacci projections.
-
What are Fibonacci numbers good for?
Using Fibonacci numbers in crypto is good for identifying key areas where the value of a cryptocurrency may reverse or stall. Fibonacci ratios are used to identify these key areas.


