Exponential Moving Average (EMA) Explained for Crypto Investors
One of the keys to mastering cryptocurrency investing and trading is getting to grips with technical analysis and using technical indicators. The exponential moving average (EMA) is a technical indicator used by crypto investors to navigate the intense volatility of cryptocurrency prices. I will cover the EMA, how it’s calculated and used, some real-world examples, and some of the pitfalls investors should watch out for when using this indicator.
The Exponential Moving Average (EMA) Explained
What is the Exponential Moving Average?
A moving average (MA) is an indicator of overall trend direction. The exponential moving average (EMA), because it is weighted, gives greater importance to the most recent asset price data in its calculation of an average.
The EMA calculation responds faster to the latest crypto price changes. It’s used to smooth out asset prices, removing short-term fluctuations and helping to overcome some of the issues of interpreting volatility for investors.
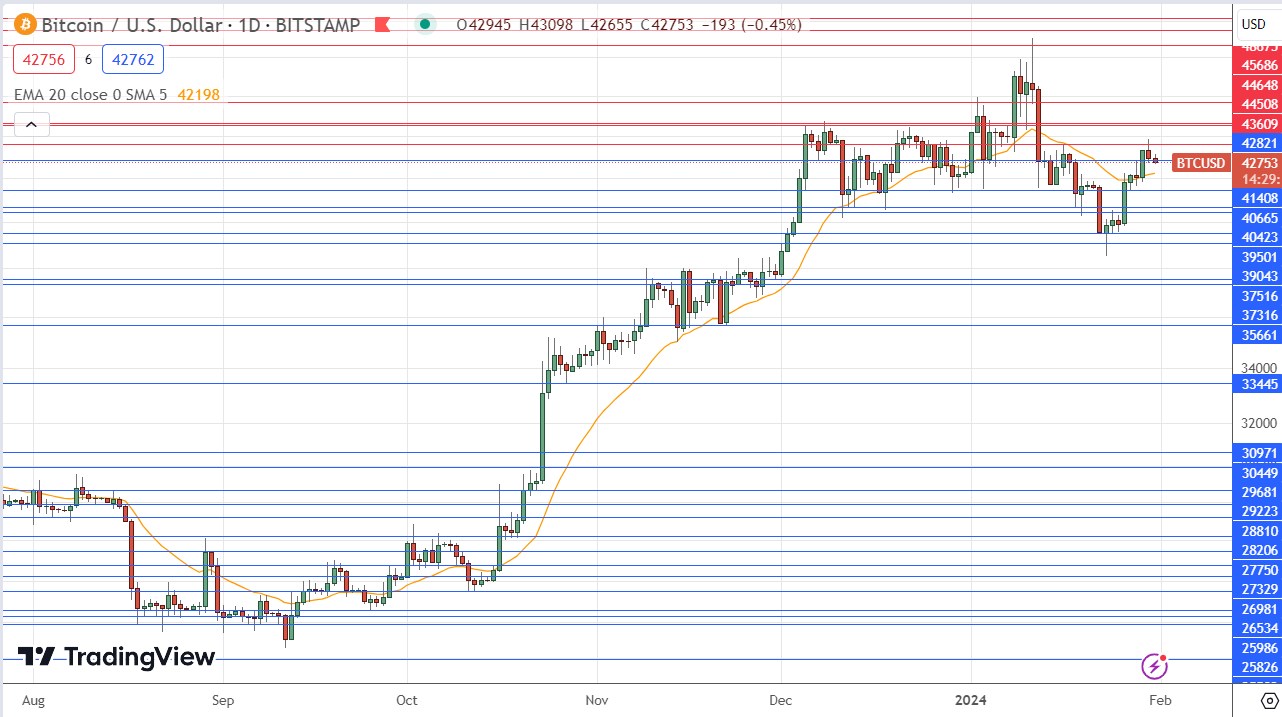
An EMA line can be drawn on a Japanese candlestick price chart.
Calculating the Exponential Moving Average
The Formula for EMA
EMA = (closing price – previous day’s EMA) x weighting multiplier + previous day’s EMA
As we can see, the formula for calculating EMA includes the previous EMA value. This means price data is current, and the newest data has more impact. In the first period analyzed, where no EMA is available for a previous period, the SMA is used.
Step-by-Step Calculation of EMA
The SMA is calculated by taking the sum of closing prices and dividing it by the number of observations for the period. To calculate a 20-day SMA, for example, the sum of the closing prices would be divided by 20.
Then, the smoothing constant, or weighting, needs to be calculated. The formula is two divided by the number of observations plus 1. For the 20-day SMA, the smoothing constant calculation looks like this:
[2/(20+1)]= 0.0952.
The smoothing factor can be increased if an investor wants there to be more weight to the most recent price data.
Example Calculation for Better Understanding
Let’s see how the 20-day EMA would be calculated on a Bitcoin/USD price chart at close on 30th January 2024.
EMA = (closing price – previous day’s EMA) x weighting multiplier + previous day’s EMA
EMA = ($42,946 – $41,990*) * 0.0952 + $41,990*
*Note that as we do not yet have the previous day’s EMA calculated, we use the value for the SMA
EMA = $42,081
The Significance of the EMA in Cryptocurrency Trading
Crypto trading analysis indicators (TA) interpret price and other data to make informed investing decisions. There are many, but moving averages are among the most popular and most consistently used. These indicators produce clarity in trading charts, smoothing out graphs to identify trading signals. As noted, the EMA can help navigate the issue of high volatility in the cryptocurrency markets.
How the EMA Differs from a Simple Moving Average (SMA)
-
Understanding the Basics of the SMA
A simple moving average (SMA) takes price data from a set period and provides the average price for the data set. With an SMA, in contrast to a basic average, the oldest data is disregarded when there is new data. So, the 20-day SMA always uses the most recent 20 days of data.
The SMA is calculated by taking the sum of closing prices in the period and dividing it by the number of observations or days. To calculate a 20-day SMA, the sum of the most recent 20-day closing prices would be divided by 20.
When using an SMA, the market is bullish if the price (and candles) move above the average. A price moving below the average could indicate a bearish market and a change in direction can indicate a trend change.
-
Key Differences Between the EMA and the SMA
The price data used to calculate an SMA is not weighted; each of the 20 days has the same influence on the outcome. The EMA emerged because investors wanted to put more relevance, or weight, to the latest price data available. The EMA responds faster to the latest price changes compared to a simple moving average (SMA).
-
Why the EMA is Preferred in Cryptocurrency Markets
The EMA is preferred in cryptocurrency markets because it is more responsive to the latest fluctuations in price and is important for navigating volatility by visualizing more gradual trends.
EMAs can predict price reversals faster than SMAs, so they are often used by short-term traders.
Applying the EMA in Crypto Trading Strategies
How to use the Exponential Moving Average – Basic Strategies
So, we’ve seen from the above graph that candles above an EMA line plotted on a price chart indicate a bullish market with excess demand. Candles below the line can show a bearish market with excess supply. The EMA will also show the reversal of an existing trend upwards or downwards into a new trend.
Cryptocurrency investors can use EMAs to try to predict what might happen to a cryptocurrency’s future price and then make a buy or sell decision based on that prediction.
To use EMAs effectively, this indicator should be understood in depth and combined with knowledge and use of other market indicators and tools.
EMAs are used alongside other technical indicators but also fundamental analysis to interpret or confirm market changes.
Advanced EMA Trading Techniques
Crypto day traders commonly use 8-day or 20-day EMAs; this means they use the price data and the formula above for the most recent eight days or twenty days. The EMA will be recalculated as soon as there is a new day’s price data. Investors or traders may adjust the smoothing constant if they require a calculation to be weighted more heavily with recent price information.
Traders or investors with a longer-term strategy may be more likely to use 50-day or 200-day EMAs.
Combining EMA with Other Indicators
Successful cryptocurrency traders and investors use a variety of indicators before investing; other commonly used technical analysis indicators include:
- Relative strength index (RSI)
- Moving average convergence divergence (MACD indicator)
- On-balance volume (OBV indicator)
- Aroon indicator
- Stochastic Oscillator
These indicators each have a different calculation; some will give more weight to price, others volume, and some both. Expert traders will have their own preferred combination or recognize when it’s appropriate to use each indicator.
Real-World Examples of EMA in Action
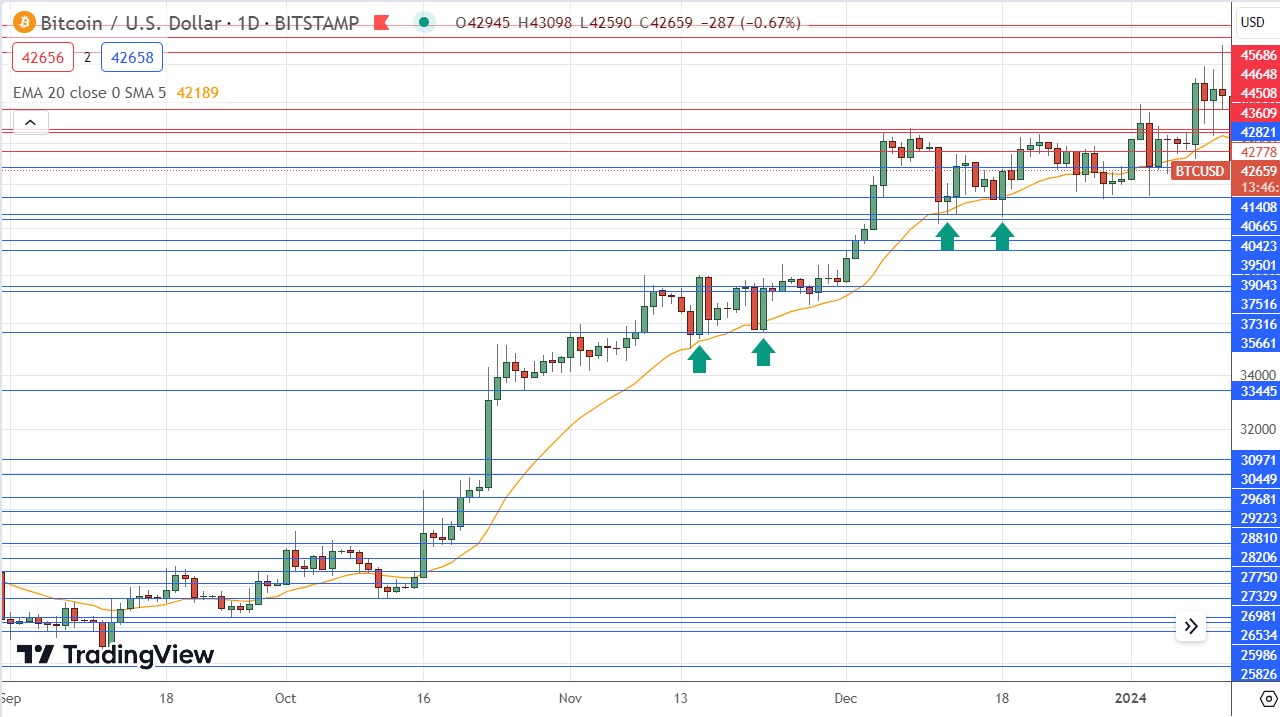
Going back to the price chart of Bitcoin/USD with the 20-day EMA applied, we can see below that from 16th October 2023 until about the start of 2024, the price action took place above the EMA, signifying a bullish, upward trend. A common method of using an EMA in crypto trading is to wait for the price to be above an upward-sloping EMA line and enter long trades whenever there is a bullish bounce rejecting the EMA line. The four green arrows within the price chart below shows where entry points would have been for several profitable long trades if this EMA crypto trading strategy had been applied.
Common Pitfalls and How to Avoid Them
Misinterpreting EMA Signals
MAs use past prices, not current prices, so do have a period of lag. The longer the time period, the greater the lag. A 100-day data set will respond more slowly to new price information than an MA based on the last 10 days. This is because a new single-day entry into a longer time period has a smaller impact on the average.
Short-term traders prefer small periods or data sets that make an EMA respond faster; this helps them with reactionary trading. Larger data sets can be more appropriate for longer-term investors because of the gentler alterations, even when there are large fluctuations. It’s important that investors and traders use technical analysis methods appropriate to their strategy and risk tolerance.
Overreliance on the EMA in Volatile Markets
The EMA can be calculated by using days or by using much shorter timescales for day traders. Hours, for example, can replace days and help navigate crypto’s intra-day volatility. One problem is the lag time, which can mean signals are too late, especially when prices are changing rapidly. An EMA has less lag than an SMA but still has some.
Sharp bullish movements are common in cryptocurrency markets, but EMAs do not show these sudden moves. EMAs can also show false signals if the market is very volatile.
Balancing EMA Analysis with Other Market Factors
Using an moving average (MA) or an EMA alone is not sufficient. As well as using other types of technical analysis methods, investors can use MAs in combination to visualize “crossover” signals where two MAs cross over. A bullish crossover is known as a golden cross, and a bearish crossover is a death cross.
A false golden cross, for example, can lead an investor to buy just before a price drop. Fake buy signals are known as “bull traps.” Combining the use of TAs can help investors avoid bull traps and weak indicators.
Future of the EMA in Cryptocurrency Trading
Innovations in Technical Analysis
Technology has already transformed technical analysis, helping traders and investors make calculations quickly, review charts, and identify trends. Popular trading platforms incorporate powerful tools and dashboards, but recent AI advances are truly transforming technical analysis. AI can analyze large data sets in seconds, combine the results of many trading indicators, and conduct fundamental analyses of the wider market and sentiment to deliver predictions and recommendations. AI is also able to adapt to rapidly changing markets and learn from feedback to continuously improve and optimize.
EMA and the Evolving Crypto Market Dynamics
The EMA is incredibly relevant to volatile crypto market dynamics and is found to be useful when combined with other indicators for navigating volatility. How the cryptocurrency markets mature will determine whether the EMA retains popularity or other indicators become more widely utilized.
Conclusion
EMAs have pros and cons and should be used in conjunction with other technical analyses and indicators. The relevance of an EMA also relies on an investor’s strategy and risk tolerance. According to Coin Hint experts To be successful, investors must understand the advantages and drawbacks and have substantial broader knowledge of markets and trading.
FAQ
-
Is EMA Suitable for Beginners in Cryptocurrency Trading?
Although learning what EMAs are and how to use them is useful, new traders should also learn other methods and indicators and how to use them in combination, watching out for any pitfalls.
-
What is the Best Period for EMA in Crypto Trading?
Investors will choose the time period for calculating an EMA based on their strategy. Short-term and day traders will use much shorter periods, whereas longer-term investors will select longer periods.
-
Can EMA be Used for Long-Term Investment Analysis?
An EMA can be used for short or long-term analysis as the appropriate time period for the data set can be selected.
-
How Does EMA Respond to Sudden Market Shifts?
An EMA is weighted so that more recent asset price moves have a greater impact. It also uses the most current data; hence, it is a moving average, but it can miss very sudden market shifts.

