How to Use Bollinger Bands for Cryptocurrency Trading?
Updated on Sep 19, 2024
Developed in the 1980s by American asset manager and technical analyst John Bollinger, Bollinger Bands® have become an essential analytical tool in the financial markets, especially for equities. At the core, the bands reveal overbought and oversold market conditions. These conditions can provide many opportunities for traders. Now, Bollinger Bands are used extensively by digital currency traders as well. Read on to learn the fundamentals and applications of Bollinger Bands in crypto trading. This guide explains how they can help you time the market better to take advantage of the many opportunities the nascent cryptocurrency market presents.
What are Bollinger Bands?
Bollinger Bands (BBs) are a popular technical analysis tool used in cryptocurrency trading. This indicator can help traders to identify entry and exit points. The indicator consists of three lines forming a channel that encompasses the price movement of the asset over a defined period. Crypto traders use BBs to identify trends, gauge volatility, and predict trend reversals by recognizing overbought and oversold situations.
How is the Bollinger Bands Indicator Calculated?
Bollinger Bands are formed by plotting three lines over the price movement chart of the asset. There are three lines within the Bollinger Bands indicator which are calculated as follows:
Simple Moving Average (Middle Band)
The first band is calculated by using the simple moving average (SMA) for N periods. Bollinger Bands typically use the 20-period moving average line as the baseline or middle line.
Upper Band
The upper band is determined by plotting the SMA plus K times the standard deviation of the price. Typically, the upper band is set two standard deviations above the middle line, but it can be customised.
Lower Band
The lower band plots the middle line minus K times the standard deviation of the price. Typically, the lower band is set two standard deviations below the middle line, but it can be customised.
Therefore,
BB = SMA ± K x SDSMA
Generally, N = 20 and K = 2, to completely enclose the price fluctuations within the band. The plots are flexible, meaning that both N and K can be adjusted as per the trader’s trading strategy. In fact, you can even go ahead and replace the middle line with an exponential moving average (EMA), and K does not necessarily have to be an integer (a whole number).
Note that the signals given by the SMA are stronger for longer periods (higher N values). However, as the period increases, the number of generated signals decreases. There is some trade-off between quality and quantity.
How to Read Bollinger Bands?
The Bollinger Bands give an immediate sense of the crypto market in a visual way.
- The middle line (SMA) indicates short-term price direction.
- The width of the upper and lower bands indicates volatility.
It is important for traders to recognize whether the market looks due for a reversal, in a continued trend, or fluctuating in a range. Only then can traders conclude whether a signal is useful. For instance, after ranging for a certain duration, if the price falls below the lower band, it is a sign of a potential reversion to the mean signaling an imminent upwards movement in the price. On the other hand, when a price trending upwards keeps pushing the upper band, the uptrend is likely to continue.
What Do Bollinger Bands Indicate?
BBs enables traders to discover a trend. It relieves the trader from manually identifying support and resistance levels, which new traders often find cumbersome, given the volatility in the crypto market.
The width of the bands and their distance from the middle line is used to formulate crypto trading strategies:
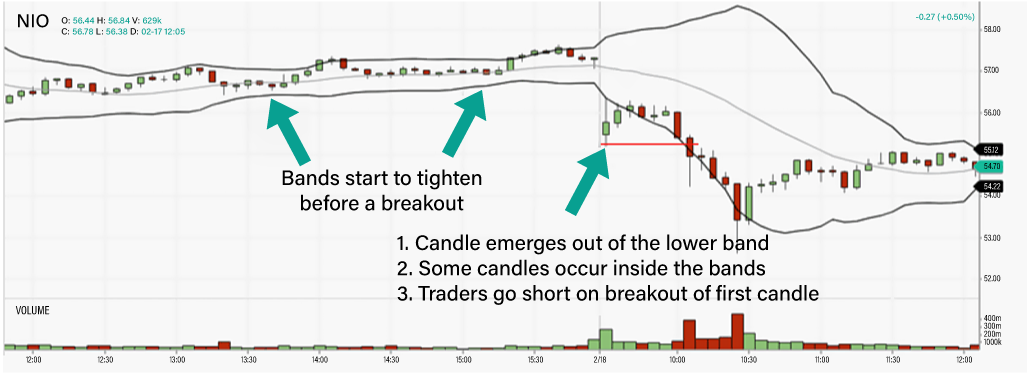
The Squeeze
When there is low volatility in the market, the bands contract. This is known as a Bollinger squeeze. After an extended period of low volatility, traders consider a candlestick closing above or below the bands, when the bands expand as an indicator of a breakout and new trend. The candlestick gives the direction of the trend, the bands indicate the volatility, and the middle line shows the momentum in the market over the look-back period, if any.
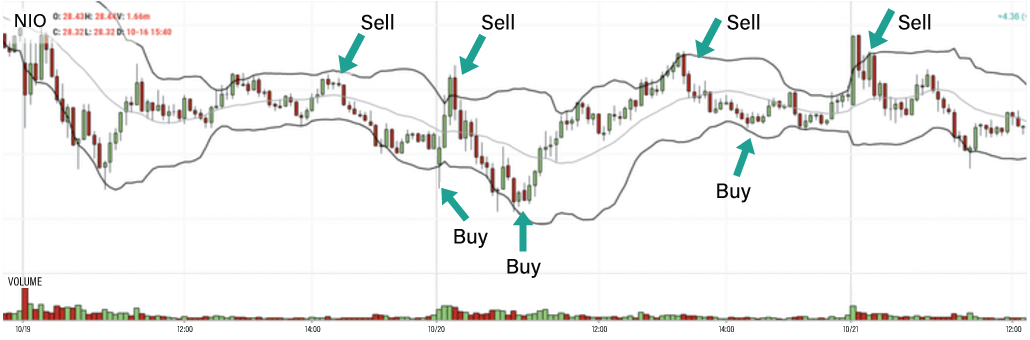
The Bounce
The Bollinger Bands bounce strategy is considered one of the simplest strategies for using Bollinger Bands in crypto trading. This strategy works best in a sideways-moving market. It is based on the principle of mean reversion, which states that if the price deviates too much from the mean (represented by the middle line within Bollinger Bands), it will soon revert to the mean. Therefore, traders try to identify whether the market is trending or ranging. When the bands are flat, they indicate that the market is ranging, and it is time to take advantage of any “Bollinger bounce” which might set up. Traders can go short when the price approaches or hits the upper band. On the other hand, if the price hits the lower band, the asset is oversold, and traders can buy the cryptocurrency.
Volatility
The volatility of an asset is indicated by the width of the bands from the middle line. The wider the bands, the higher the recent volatility. Traders can use the volatility level as a guide in setting stop losses in trades. This can give trades more realistic “room to breathe” and prevent good trades from getting stopped out too early.
How Does the Bollinger Band Indicator Work?
Crypto Bollinger Bands work similar to any traditional asset.
Traders typically use a plot of %B (percent bandwidth), which quantifies the price action relative to the bands, as a means of interpreting price action along with the position of the price and the bands. This functions like an oscillator that helps traders identify entry and exit points.
Here’s how to interpret it:
- %B > 1 indicates the price is above the upper band.
- %B = 1 indicates that the price is at the upper band, or that the middle line is colliding with the upper band.
- %B > 0.50 suggests that the price is above the middle band or the reference line.
- %B < 0.50 indicates that the price is below the middle line.
- %B = 0 means that the price is at the lower band.
- %B < 0 means that the price is below the lower band.
How to Use Bollinger Bands in Cryptocurrency Trading?
The trader and their trading strategy determine how BBs are used for trading cryptocurrencies. Traders often use this indicator as described below:
Short Term Trading
The trading period (N) is 10, and K is 1.5. It is suitable for day traders. For scalping, the timeframe can be 10 minutes, while in intra-day trading, it could be 10 days.
Medium Term Trading
An SMA period of 20 (days) and a standard deviation distance of 2 is often used to plot the bands. Swing traders and day traders who prefer to keep their positions open overnight use this strategy.
Long Term Trading
An SMA of 50 (days) and a standard deviation distance of 2.5 is often used in long-term trading. This strategy helps position traders’ open positions for a few weeks to a few months.
Traders should confirm a trend continuation or a reversal (with the help of other indicators or after waiting for a little while) before entering a new trade. Additionally, despite thorough technical analysis, markets may move unpredictably. So, it’s important for traders to adopt risk management strategies to limit their losses when the crypto moves against their expectations.
Day Trading Uptrends with Bollinger Bands
This strategy works with an SMA of 20 days or more. When trading an uptrend, traders need to keep an eye on the market for any pullbacks. When a price pullback occurs and remains above the middle line to finally rebound toward the upper band, it indicates the market’s bearish potential. However, if the price action approaches closer to the lower band, it means the uptrend is losing strength and it is time to re-evaluate open positions. For instance, a failure of the price to make new highs suggests long positions should be closed to prevent losses.
Day Trading Downtrends with Bollinger Bands
In a bearish market, BBs help traders find the downward strength of the price action. A strong downtrend shows price movements closer to the lower band. When the price fails to hit new lows, it signals a weakening of the bearish momentum. Short sellers exit their positions at this point.
For beginners, who are uncomfortable trading in bearish markets, a good strategy is to identify and buy the dips. However, this requires more in-depth fundamental analysis to determine the long-term growth potential of the cryptocurrency.
Using Bollinger Bands with Price Patterns
Candlestick price charts exhibit some patterns that have proven useful for many to make trading decisions:
‘W Bottom’ Pattern
A valid W-bottom occurs when the first low is beneath the lower band and the second low is within the bands. A bounce back from the second low indicates an uptrend and traders may go long.
‘M Top’ Pattern
The condition of a valid M-top is that the first high occurs outside the upper band and above the second high. In addition, the second high should fall within the bands. This pattern is visible when a rally ends in a pullback and a second one failed to breach the resistance level. Under this situation traders typically go short.
Treat Bottoms and Tops Differently
Identifying a trend correctly is essential when trading. Keep the following in mind while looking for signals:
- A W-bottom will occur after a downtrend. Traders have to ensure that the two bottoms meet the conditions discussed above.
- An M-top can occur when an uptrend is due for a reversal, indicating the price will trend downward for a while. Again, ensuring that the two tops meet the conditions is very important.
Limitations of Bollinger Bands
The challenge that traders face is to decide the appropriate BBs settings for the cryptocurrency they are trading. New traders can start out with demo accounts to practise working with BBs to develop a trading strategy that aligns with their financial goals. They can assess the behavior of the asset and try out different settings to know what works. It’s important to remember to try out multiple timeframes and different deviation multipliers (notably 1 or 2 standard deviations) before trading in the live markets with real money.
Final Thoughts
Bollinger Bands have proved useful for trading cryptocurrencies for novice and experienced traders, both in identifying and evaluating trends, and as a mean reversion trading tool. However, it is important to develop a strategy that aligns with trading goals by practising on a demo account. Additionally, for a nascent and volatile market like cryptocurrency, traders should adopt a strong risk management strategy.
FAQ
-
Is Bollinger Bands a good indicator?
Yes, Bollinger Bands are a popular indicator in crypto trading because of their ease of use and application across diverse market conditions.
-
Do Bollinger Bands work with crypto?
Yes, many cryptocurrency traders have benefitted from using Bollinger Bands. However, it is best to use a secondary indicator to confirm signals and use risk management techniques to limit losses.
-
Which indicator works best with Bollinger Bands?
The %B indicator derived from Bollinger Bands is the most popular pairing among crypto traders. However, stochastic and RSI (relative strength indicator) can be paired easily with BBs.
-
What should I set my Bollinger Bands to?
The ideal Bollinger bands settings for crypto trading can be determined by practising different strategies on a demo account. Some popular settings are:
- The trading period is set to 10 and K is 1.5 for short-term trading.
- An SMA period of 20 (days) and a standard deviation distance of 2 is used to plot the bands from medium-term trading.
- An SMA of 50 (days) and Bollinger Bands at 2.5 is used in long-term trading.
-
How do you use Bollinger Bands effectively?
To use BBs effectively, traders must practise on a demo account. It’s also important to use good risk management techniques, as cryptocurrencies tend to spike and plummet often.
-
What timeframe is best for Bollinger Bands?
Different timeframes can be used for different trading strategies. For instance, a timeframe of 10 minutes works for scalping, while 10 days may work for intra-day trading.
-
What are the three lines in Bollinger Bands?
The three lines in BBs are:
- The simple moving average (SMA) – This is the baseline, middle line or reference line of price movements.
- The upper band – This is formed by plotting a fixed positive standard deviation across the middle line.
- The lower band – This is formed by plotting a fixed negative standard deviation across the middle line.
-
How accurate is the Bollinger Band?
The accuracy of any indicator depends on the way it is plotted. For BBs, longer timeframes are more accurate but provide fewer opportunities. Other factors, like market sentiment and news updates, also influence crypto markets, but are not captured in price charts.
-
 What Is Technical Analysis in Crypto Trading?Technical analysis in crypto trading refers to the examination of price charts, chart patterns, and trading activity using historical price data, with the aim of predicting possible future price movements. This article discusses the key concepts of technical analysis, including the use of charts, candlestick patterns, and different types of indicators to determine possible price movements. This trading approach is suitable for both beginners and experts, and it can help them identify market trends and make strategic decisions in the crypto market.
 -
 Exponential Moving Average (EMA) Explained for Crypto InvestorsOne of the keys to mastering cryptocurrency investing and trading is getting to grips with technical analysis and using technical indicators. The exponential moving average (EMA) is a technical indicator used by crypto investors to navigate the intense volatility of cryptocurrency prices.
 -
 What is Moving Average Convergence Divergence (MACD) Indicator?Moving Averages Convergence Divergence (MACD) is an extremely popular indicator used by traders across a wide range of financial instruments. It has gained the attention of crypto traders over the past few years.
 -
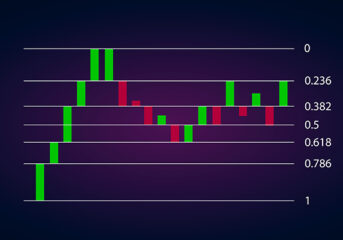 How Are Fibonacci Retracement Levels Used in Crypto Trading?Leonardo Pisano Bigollo learned the Fibonacci sequence from Indian merchants and introduced it to the Western world in 1202. This was when he designed the 'new' number system with 0. Since then, patterns and ratios in a wide range of micro and macro phenomena are understood with the help of the Fibonacci sequence. Its applications have come a long way, from studying natural phenomena to determining support and resistance levels in financial markets. Read on to learn what the Fibonacci indicator in crypto is. This guide also explains how the Fibonacci indicator can be applied to make more profitable trading decisions in the often-erratic crypto market.
 -
 Relative Strength Index – What is RSI, and How to Use it for Crypto Trading?Crypto traders use technical indicators like the relative strength index (RSI) indicator to determine whether a crypto asset is ‘overbought’ or ‘oversold’. Because the cryptocurrency market is incredibly volatile, technical indicators provide a way for crypto traders to plot entry and exit points.
 -
 Moving Average – Definition and Why is it Useful for Crypto Trading?The moving average (MA) is a popular technical indicator used by crypto traders to smooth out price action by filtering ‘noise from the market’ (short-term and random price fluctuations). The moving average indicator is a lagging indicator, which means that it is based on past prices. As such, it can only really be seen to confirm a pattern, not predict it. Looking to learn how to use the moving average indicator to trade crypto profitably? Keep reading!
 -
 Trend Lines Indicator for Crypto TradingThe trend line is a popular technical analysis tool that crypto traders use to determine the direction of a trend. They are drawn along a trend’s extreme data points, allowing traders to determine all important support and resistance levels. This article will discuss the basics of trend lines in crypto and how you can use them to make better trading decisions. If you find technical analysis intimidating, understanding how to identify trend lines is a fantastic way to start, so keep reading.