Best Bullish Candlestick Patterns to Trade Crypto
Updated on Jun 03, 2024
Cryptocurrency markets are known for generating impressive returns. For traders to take advantage of these opportunities, it is essential to identify and enter trends at the onset. Patterns formed by candlesticks are the most popular indicators of an imminent bull run. Read on to learn all about the three major bullish candlestick patterns and more, and how you can use them in crypto trading.
Candlesticks at a Glance
Candlesticks represent a lot of information in a concise way and technical analysts believe that this historical information can sometimes be used to predict future price action. Although High Low Open Close (HLOC) charts depict similar information, most traders prefer Japanese candlesticks as they are easier on the human eye to understand and analyze.
Named after the way they look; candlesticks are one of the most popular analytical tools used in the financial markets. Crypto traders too have embraced candlesticks, which form the basis of the pattern-based trading system pioneered by Munehisa Homma, a Japanese rice trader.
What Does the Candlestick Size Indicate?
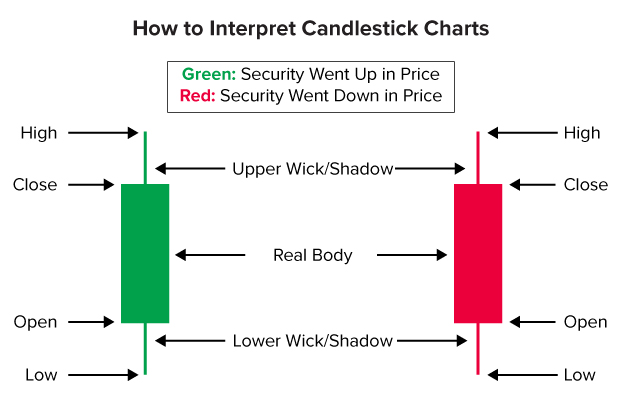
The body of the candlestick marks the opening and closing prices of the cryptocurrency during the period. This is depicted by the height of the body of the candle. The wicks of the candle, if there are any, show the highest and lowest prices which were reached during the period represented by the candle. If there is no wick, then the edge of the real body indicates the highest or lowest price.
What Does the Candlestick Colour Indicate?
A red colour is usually used to indicate that the asset closed lower for the duration. A green or sometimes blue colour indicates that the price rose and ended higher than where it opened during the timeframe. The colours can be customised according to preference in many charting software packages.
What Do the Candlestick Wicks Indicate?
The wicks or shadows indicate the highest and lowest price hit by the asset during the period of the candle.
How to Read a Candlestick
Candlesticks include a lot of information, and with some practice, traders can grasp it all at once.
Here’s how you can read one:
- Short or missing wicks can indicate momentum in the direction of the missing wick.
- Long wicks show areas of rejection. For example, a long upper wick might mean the bulls could not manage a breakout.
-
The wick length as a proportion of the overall candle size conveys the following information:
– Below 5% indicates a very strong close of the candle.
– 30%-35% means that both bulls and bears were quite active and there is indecision regarding the price.
– 50%-67% may indicate a weak close.
– A wick of 75% or more means that a reversal may be happening.
Remember
During periods of high volatility, both wicks can be quite long (more than 50% of the size of the candle). The trend direction and candle colour become critical to gauge which shadow (upper or lower) to use.
What is a Bullish Candlestick Pattern?
Homma identified some rules showing how certain candlestick patterns can predict a rise or fall in prices with some probabilistic accuracy. The rules, now known as Sakata rules, helped him anticipate rice prices and to profit accordingly.
The patterns created when there is upward pressure on the price combined with Sakata rules help identify bullish signals in cryptos that guide trading decisions.
Types of Bullish Candlestick Patterns
Bullish candlestick patterns in crypto can consist of one or more candlesticks. Depending on the ongoing trend, candle colour and wick, most traders recognise the following as bullish signals in crypto:
1. The Bullish Engulfing Candlestick
A bullish engulfing pattern is a two-candle pattern. A bearish (red) candle engulfed by a bullish (green) one signals a bullish reversal. Here, the low of the bullish candle is not lower than that of the previous candle, and the high is at least twice its size. A bullish candle above the middle of the second candle following the pattern confirms the reversal.
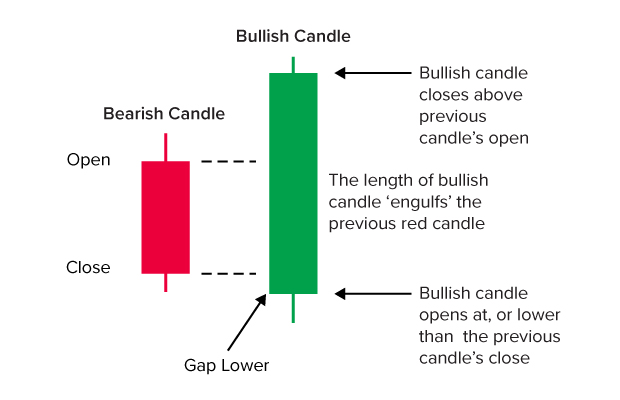
Trading Tip
Aggressive traders prefer to open long positions closer to the end of the second candle with a stop loss close to the lower wick. However, conservative traders may wish to wait for another bullish candle before entering the market.
2. The Bullish Harami Pattern
Bullish harami is a pattern formed when a bearish candle is followed by a bullish candle less than 25% of its size. The price action of the second, called the shortline, falls completely within that of the first candle. This means that the red body engulfs that of the green and even the wicks of the second candle lie within the highest and lowest of the first candle.
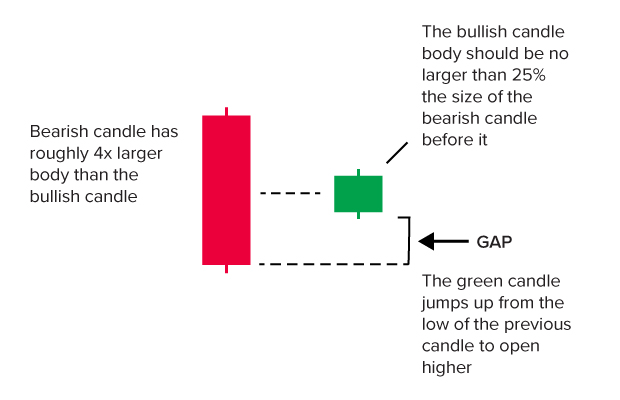
Trading Tip
Some traders open long positions after the trend is confirmed with stop losses at the lower end of the second candle.
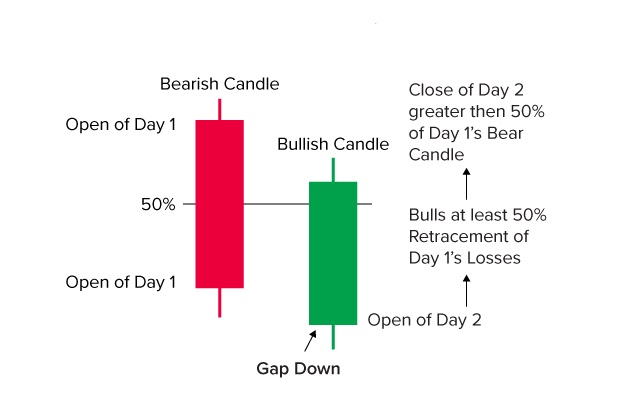
3. The Piercing Lines Pattern
A piercing line pattern is formed when the top of a bullish candle lies above the middle of the range of a previous bearish candle. The second candle starts at a lower price than the first, but ends higher than its middle, indicating a larger body and strong bullish forces. A gap down at the beginning strengthens the fact that there was consistent buying pressure throughout the period that pushed the prices higher despite a slow start.
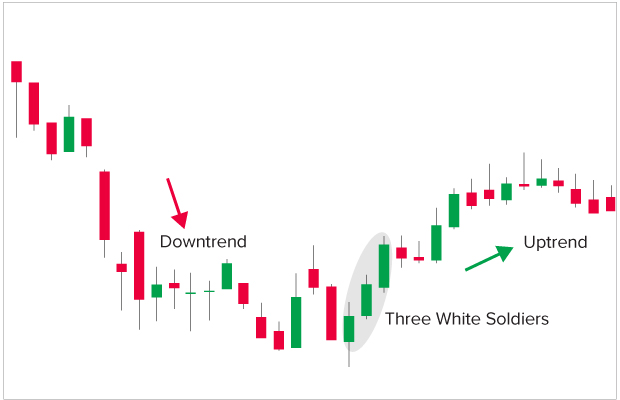
4. The Three White Soldiers
Three bullish candles after a downtrend can be a very strong bullish chart pattern in crypto. Three consecutive green candles, each starting above the middle and ending higher than the previous, form three white soldiers. They signal a strong upward sentiment after a downtrend. This means buyers have gained strength versus the sellers, and a rally has begun.
Trading Tip
Traders can take long positions after confirming the trend with a fourth candle. However, exercise caution if a bearish candle follows, as that may indicate high selling pressure and prevent the bullish reversal.
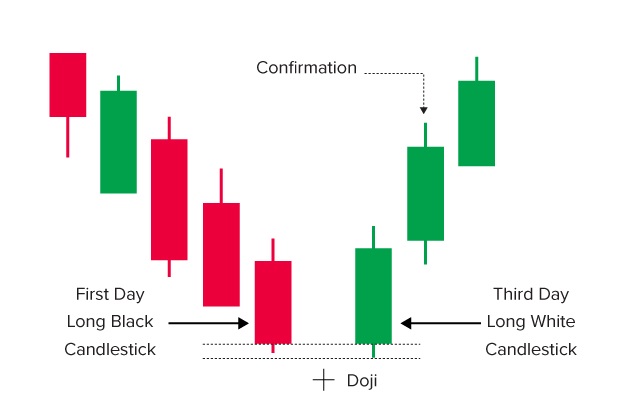
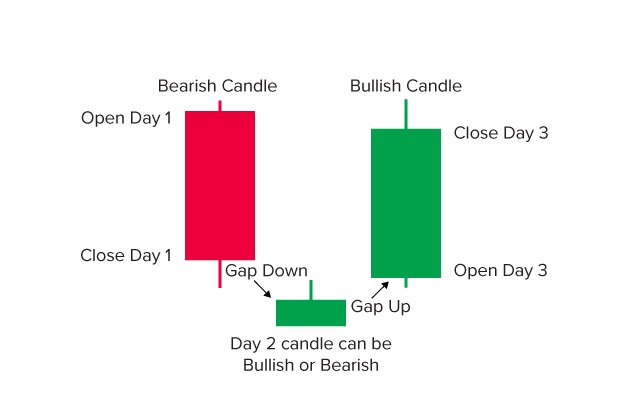
5. The Bullish Abandoned Baby
This one is a rare pattern which indicates a price reversal. It is a three-candlestick pattern starting with a large bearish candle within an ongoing downwards move. The candle is followed by a doji that opens around and gaps below the close of the first one. A large bullish candle with an opening price gaping above the doji completes this pattern.
Trading Tip
Traders typically take long positions at the close of the pattern and put stop loss limits close to the low of the third bar. More optimistic traders can choose a stop loss close to the lower wick of the abandoned doji.
6. The Morning Star
The morning star is another popular three-candlestick bullish pattern in crypto. The pattern is formed when a large bearish candle is followed by a tiny candle marking the low of the pattern that is then followed by a large bullish candle. The low is apparent only after the third candle of the pattern has closed. The middle candle, or the morning star, marks the time of indecision in the market, which sets the tone for the reversal. Traders typically take bullish positions at the close of the third candle, after ensuring that the pattern is accompanied by rising trade volume through the three candlestick durations.
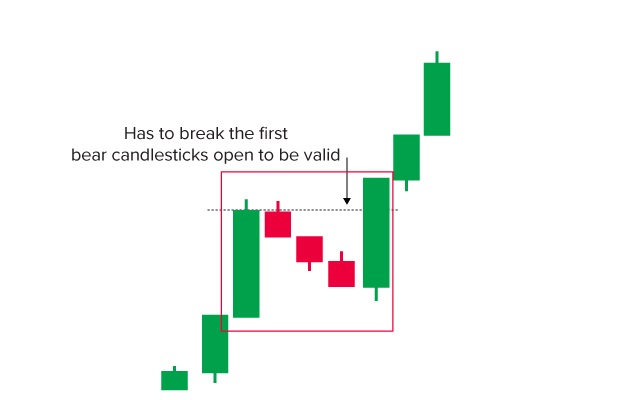
7. The Rising Three Methods
The rising three methods is a bullish pattern formed by three bearish candles within an upwards price movement. It is a trend continuation pattern. Three small bearish candles, each having lower lows than each previous one, form the pattern. However, the pattern and bullish sentiment are confirmed only after a large bullish candle with a high higher than all three bearish candles appears. It shows the conviction of the bulls and their strength overcoming the earlier selling pressure.
Trading Tip
Often, traders take long positions at the end of the third or the beginning of the fourth candle. However, it’s important to be cautious in case the fifth candle is bearish, as this may indicate a trend reversal.
What are Bullish Reversal Candlestick Patterns?
Bullish reversal candlestick patterns are chart patterns which indicate the potential reversal of an existing downtrend, suggesting that the trend will reverse and a new bullish movement or trend is beginning. Some of the most noted bullish reversal candlestick patterns include the pin bar / hammer, the bullish engulfing pattern, the piercing line, the morning star, and the three white soldiers.
Bottom Line
Price action can be a very effective method to time trade entries and exits, although the level of candlestick pattern recognition and analytical skills required can take a meaningful amount of practice to get right.
If you are bullish on a cryptocurrency and see a bullish trend on higher timeframes, drilling down to lower timeframes and spotting any of the bullish candlestick patterns this Coin Hint article presents can be a great way to find effective low risk high reward entry points for long crypto trades.
FAQ
-
Do candlestick patterns work for crypto?
Yes, candlestick patterns work for crypto and for all asset classes. Since cryptos have had long rallies, trend trading crypto can be exciting and full of opportunities.
-
Which candlestick is the strongest bullish candlestick?
Individual candlesticks are less reliable than candlestick patterns composed of several consecutive candlesticks, but of all individual candlesticks, the strongest bullish candlestick is probably a bullish pin bar with an unusually large price range.
-
Which candlestick pattern is the most bullish?
The clarity and strength of a bullish pattern is a better indication of its bullishness than the fact that it is a particular chart pattern.
-
What is the best bullish chart pattern?
Probably the most widely respected bullish chart pattern in the head and shoulders pattern, which shows a transition from lower lows to a first higher low.
-
 What is Yield Farming in Crypto, and Does it Work?Cryptocurrency yield farming emerged in 2020 and quickly grew in popularity. Although the total value of crypto locked up in decentralized finance (DeFi) projects has fallen back somewhat from its initial high, yield farming consistently remains an attractive sector for crypto investors.
 -
 4 Proven Swing Trading Strategies for Cryptocurrency TradersCryptocurrency traders can leverage any number of crypto trading strategies for success. Swing trading is one such strategy, and it offers traders a slower pace than day trading strategies.
 -
 How is a Cryptocurrency Exchange Differ from a Crypto Wallet?The two most common mediums for accessing cryptocurrencies are exchanges and wallets, but their purpose and functionality differ substantially. At the simplest level, exchanges allow users to buy, sell, or trade cryptocurrencies, whereas wallets hold crypto balances and facilitate crypto transfers, but there’s far more to these two crypto tools.
 -
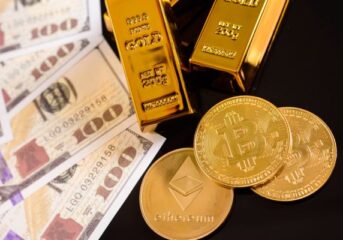
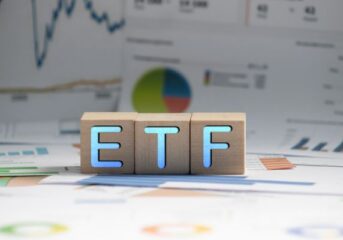 Exploring Bitcoin Exchange-Traded Funds (ETFs): Benefits and Investment OpportunitiesThe cryptocurrency saw a landmark moment as the US Securities and Exchange Commission approved 11 spot bitcoin exchange-traded funds (ETFs). These ETFs provide mainstream investors regulated access to an asset that tracks the price of Bitcoin without the need to access a cryptocurrency exchange and buy Bitcoin.
 -
 How is a Transaction Verified on a Cryptocurrency Network?In this guide, I will explore how cryptocurrency transactions happen and how blockchain technology secures transactions. Then, I’ll cover the role of nodes and some of the most common consensus mechanisms before touching on some of the issues and concerns and the potential future of transacting with blockchain.
 -
 Learn How to Trade Cryptocurrencies Like a Pro – Step by Step GuideThe following is an overview of how to trade cryptocurrency for beginners. It’s a place to start the in-depth research needed to master cryptocurrency markets and mitigate the risks of beginner cryptocurrency trading strategies.
 -
 Understanding Crypto Arbitrage: Strategies for Low Risk in Crypto TradingOn the financial markets, one of the most potentially profitable, low-risk opportunities for traders is a strategy called arbitrage. Crypto Arbitrage involves capitalizing on asset price discrepancies across different exchanges. Since these discrepancies occur in all financial markets, arbitrage is a well-known practice across all asset classes.